
“The only thing that’s new is the history you don’t know.”
Harry S. Truman
Anxiety, dread, sleepless nights – all valid descriptors of investor life today and for the past nine months. Watching one’s net worth melt is never easy or comfortable. And most investor memories of bad times are short. So let’s add a bit of perspective before we delve into the current situation. Most pundits are comparing today’s circumstances to the late 1970’s, the last time the world suffered from dramatically high inflation rates and their concomitant high interest rates. We would argue that the time periods are quite different – but this is the comparative being offered by most influencers. Here are some facts:
1) Inflation as measured by the CPI was 9.1% in 1975 and peaked in 1980 at >14.0% (today it’s around 8% and going down)
2) At the start of 1975 the 10-year Treasury yielded 7.5% and in November 1980 it was 12.7% while peaking in 1982 at 15% (today it’s around 4%)
3) Fed funds peaked in 1980 at 20% (today it’s around 3%)
4) The largest drawdown on the S&P 500 during this period was approximately 28% (today it’s about 23%)
5) Between January 1975 and November 1980, the S&P 500 rose from 438 to 487– before it began its ascent to 2400 in March of 2000, the time of the next major market meltdown because of the internet bubble
High inflation is not good and it is the Fed’s job to achieve stable prices and thus not have high inflation. The Fed is on task and has said it will defeat inflation. People seem to believe the Fed as inflation expectations appear well anchored at around 2% for the long term. But as seen above, even during periods of elevated inflation, the US stock market can hold its own and then make significant progress once inflation is in the rear-view mirror.
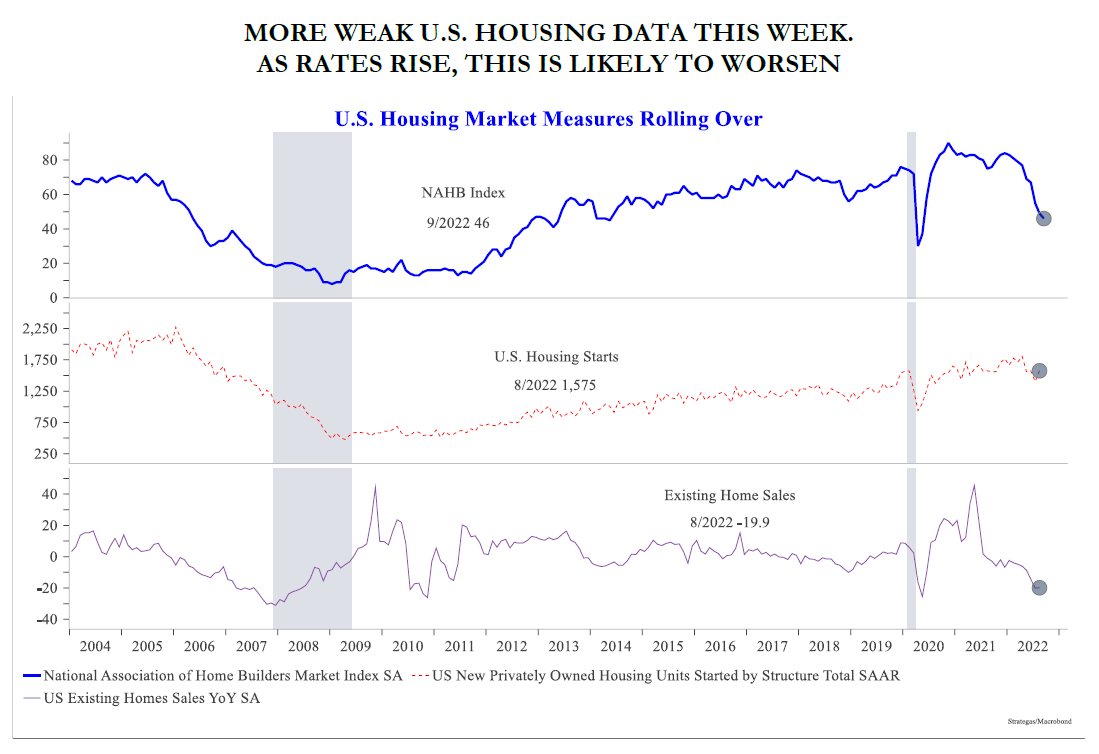
Let’s examine what is going on today by examining some forward-looking inflation charts that provide some “predictive” capability regarding the future path of inflation rather than focusing on backward looking CPI curves. Housing has skyrocketed in price over the last decade until just recently when, for the first time in 10 years, new home prices fell according to the Case-Shiller Index. Mortgage rates have doubled to nearly 7% during 2022, which has slowed sales as seen in Chart 1 below.
Chart 1
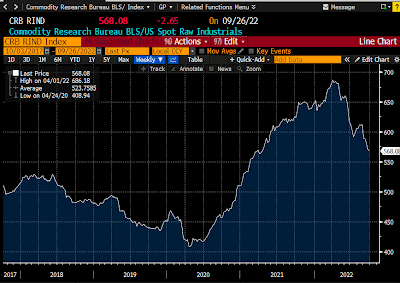
The CRB Raw Industrials Index is down 18% since its early March high.
Chart 2
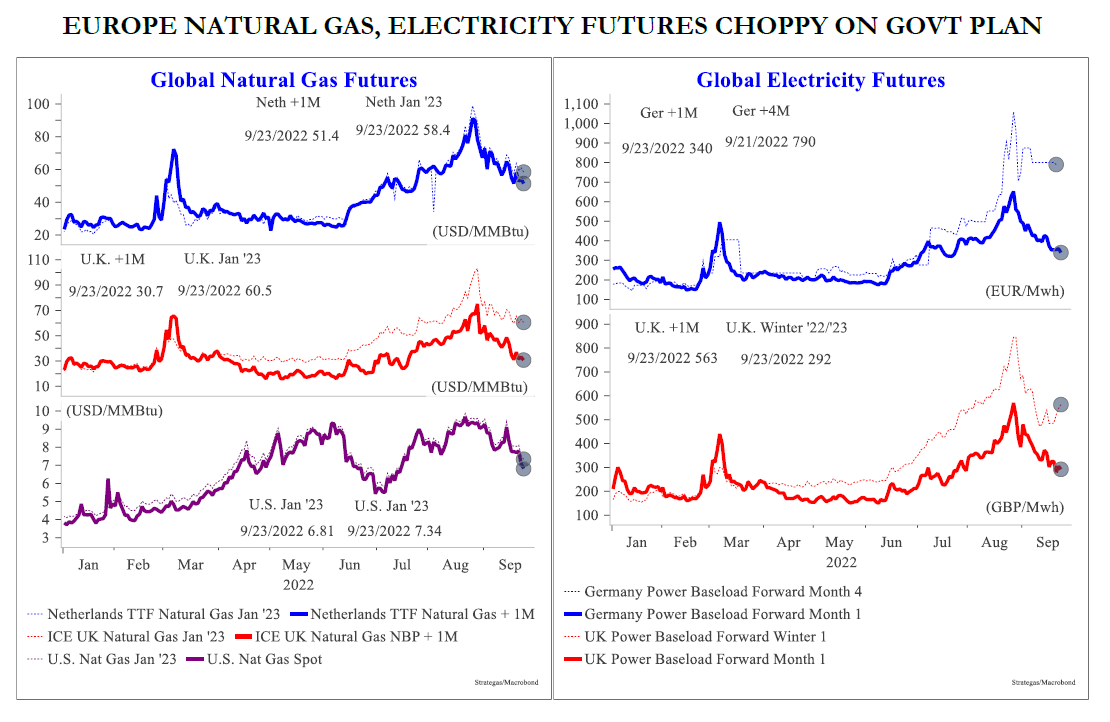
Natural gas futures as well as electricity futures are down as shown in Chart 3.
Chart 3
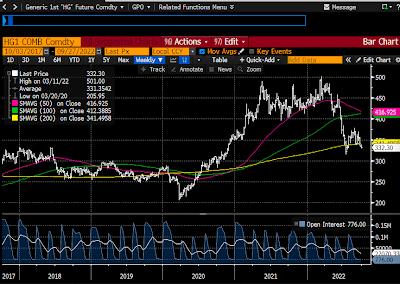
Copper prices are down 35% since March.
Chart 4
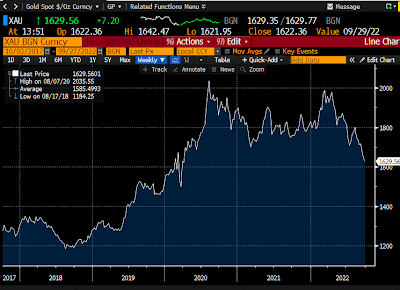
Gold is down 22% from its March high, which might suggest that the Fed is being a bit too tight with monetary policy.
Chart 5
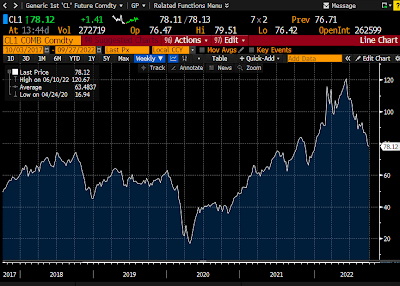
Even crude oil is also well off its highs for the year despite the fact of a war going on in Europe involving one of the world’s major oil producers, Russia.
Chart 6
All of this forward-looking data would suggest that perhaps we have seen the “peak” in inflation, which would obviously be good news.
To combat inflation the Fed has essentially one tool and that is higher interest rates. Making money more expensive is good for savers and bad for borrowers. Making money expensive means fewer “deals” get done, fewer things get purchased, money velocity slows and inflation comes down because there are fewer dollars chasing items or services for purchase. The worry is that while everyone wants the Fed to succeed in its fight against inflation, people worry that the Fed’s tool of higher interest rates might be too blunt an instrument and plunge the US economy into a recession. Right now, it is thought that the Fed might push the Fed Funds rate (its primary interest rate tool) up to about 5% and this would cause a recession. We are not so sure.
Chart 7
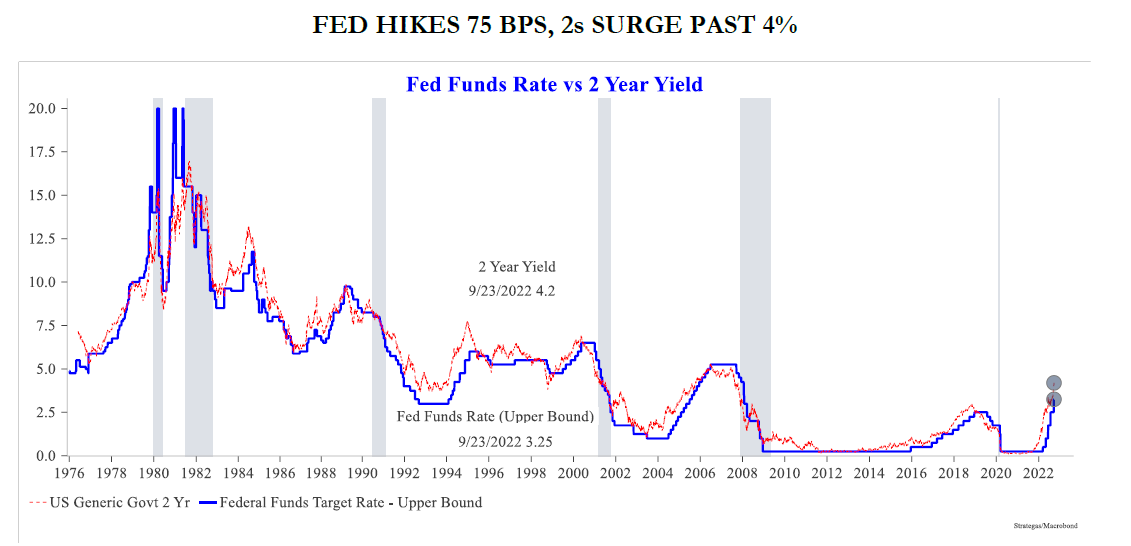
As can be seen in the above Chart 7, the Fed Funds rate (the blue line) has since 1976 spent most of its time at or above the 5% level without causing a recession as demarcated by the gray bands on the chart. We are not convinced about the causality or the worry. Rising interest rates do risk recession. We are just not sure at what level of rates would cause a recession right now. In past Commentaries we have noted the financial strength of the American consumer who incidentally comprises about 70% of the US economy. We have also outlined the balance sheet strength of corporate America along with state and local governments which are rebating tax dollars to constituents. In fact, we have noted that the only major entity which would be harmed by rising interest rates would be the federal government, which has taken on a lot of debt recently. So with the American consumer fully employed and cashed up, with corporate America in good financial shape and with an increasing number of state and local governments returning money to their citizens, where is a recession (especially a severe one) going to arise? We’re not sure.
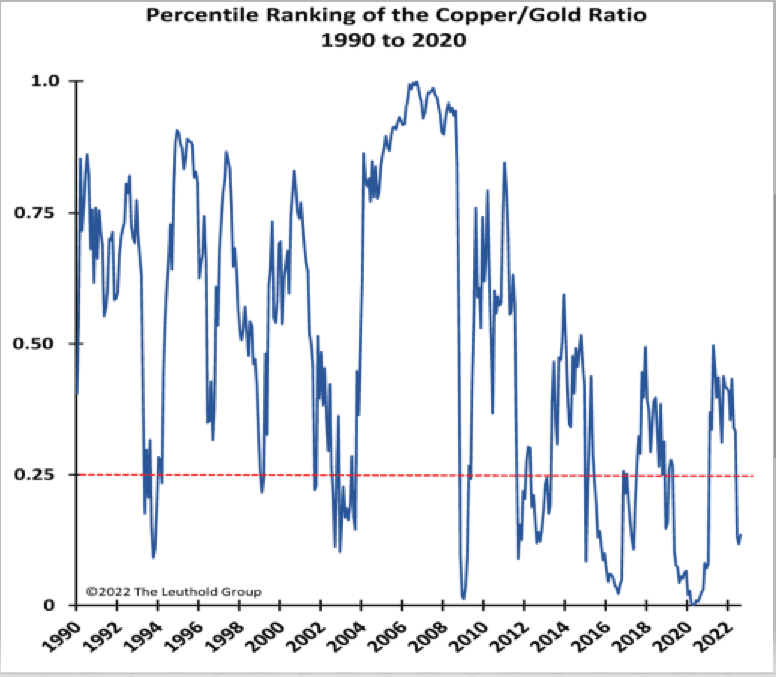
Let’s turn our attention to a couple of sentiment graphs which have served investors well in the past as contrary indicators. The first is a ratio developed by James Paulsen, the Chief Investment Strategist for the Leuthold Group, a major institutional investor. This ratio of copper/gold prices measures confidence (represented by copper prices) vs. fear (represented by gold prices). Copper is an important industrial metal used in housing, autos, electrification, etc. When economies are booming (confidence) copper use surges. Gold is considered a hedge against turmoil (fear). When countries break down and when inflation roars, people buy gold to protect their wealth.
Chart 8
Source: Seeking Alpha
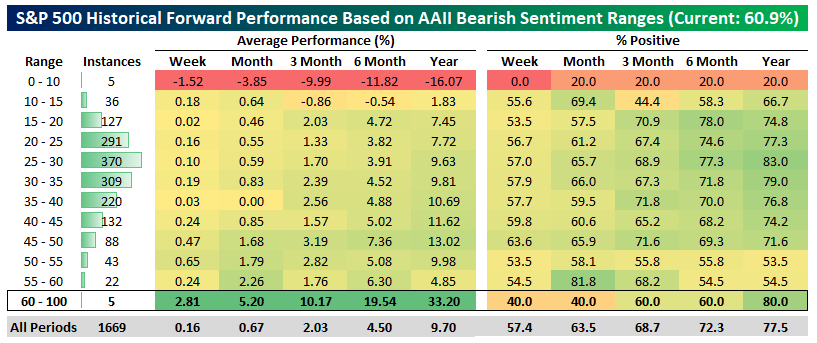
Currently, confidence (due to low copper prices) is “cheap” to fear (relatively high gold prices). Historically, when the ratio is in the lowest quartile, as it is now, it has proved to be a great time to buy stocks. Similarly, the American Association of Individual Investors has recently seen respondents to its weekly bearish sentiment survey cross above 60. This means that investors are very worried about the outlook for the markets. Since 1987, this has been a very rare event – only 5 instances. Interestingly, this sort of reflection of deep investor pessimism has historically not been actualized in year ahead market performance. Quite to the contrary, the subsequent 12-month average performance was +33.20% for the S&P 500 after such a low investor sentiment score.
Chart 9
Source: Bespoke
Overseas, the world continues to be a mess. Foremost amongst investor concerns is the war in Ukraine and its obvious spillover effects on Europe as well as the rest of the globe. The Ukrainian armed forces continue to surprise the Russian forces as well as America and NATO. Determined to protect their homeland, Ukraine is “punching well above its weight” and impressing many while embarrassing the Russian hierarchy and Putin in particular. How it will end, nobody knows. But certainly, Ukraine right now seems to have momentum. Economically and politically the rest of the world is adjusting to the new circumstances. The transition to a world with much reduced Russian energy sources has created a lot of angst in a number of European capitals. So far, Europeans are coping, while damage is being done to the Eurozone economies. A recession in Europe seems quite possible, if not probable in the near term. In Asia, China has become more aggressive. Belligerence from Beijing was amped up after Nancy Pelosi paid a visit to Taiwan. More infringing Chinese flights over Taiwanese airspace, more missiles flying and landing in waters around Taiwan and more ships sailing closer to territorial waters have put diplomats on higher alert. Stridency is not only evident in Chinese foreign affairs but also domestically. Intermittent Covid shutdowns continuing to snarl manufacturing and logistics have angered quite a few Chinese citizens who have displayed their displeasure with rounds of “pot banging” outside of apartment windows. China has become an unreliable manufacturing partner because of the Covid shutdowns. So a number of foreign companies have started to move new manufacturing capacity away from China to new locales like India or Mexico. The real estate meltdown in China has turned what was the favorite investment tool for the Chinese into a nightmare. Pre-paid but unfinished apartments are now not having their mortgages paid by the borrowers. This has sent an alarm right to the top in Beijing. What cannot happen is a contagion from real estate to the banking industry. For if that were allowed to happen, China could face a severe recession. In 2022, China is not expected to grow – pretty shocking. All in all, China is not in a good spot right now. In Italy, a far-right political party assumed the leadership of the Italian parliament with its leader (Meloni) to become the Prime Minister of Italy. So there arises a new question mark about how Italy, the third largest economy in the Eurozone, will interact with its peers. In the UK, there has been a change of government and quite a change in fiscal policy as recently announced by the new Chancellor of the Exchequer. Markets did not react well to the news as the pound sterling fell to new lows vs. the dollar. Finally, in Japan, the government continues to allow the Japanese Yen to devalue with a low interest rate policy. This strategy will one day wear thin in international markets, because inflation will “pop”.
In the midst of all the aforementioned confusion with asset values declining, it is tempting to do something, anything, to try to regain control of one’s financial picture. It is hard to sit back and watch unrealized gains disappear. But there has been plenty of research that well demonstrates that it is better to sit on one’s hands, to stay fully invested than to attempt to time a market. From The Vanguard Group comes the following chart:
Chart 10
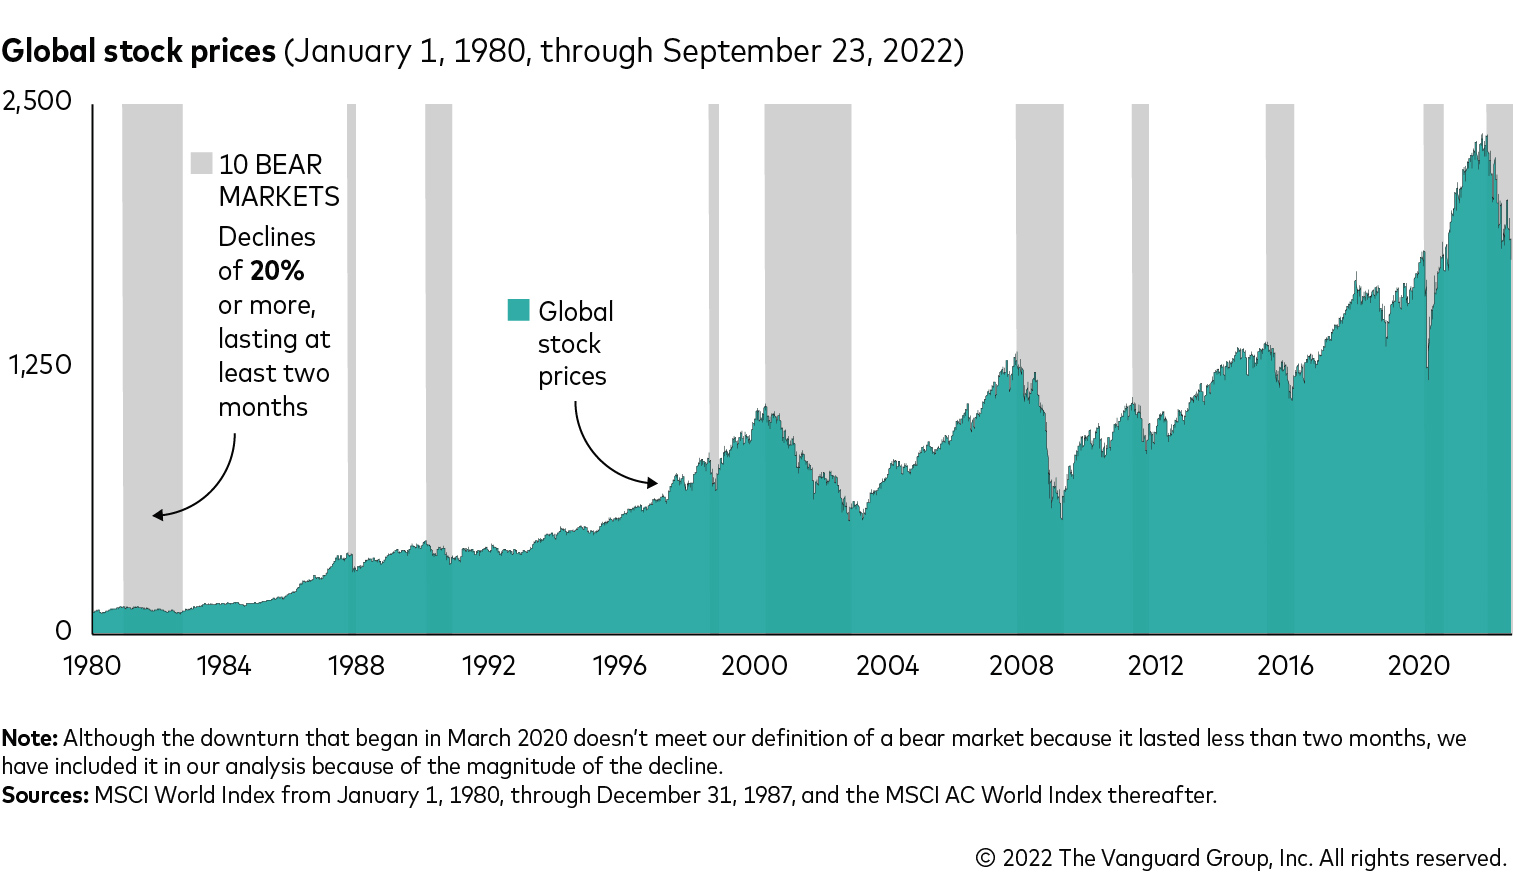
Sharp downturns in global stock markets, while painful, are not uncommon. Since January 1,1980 and until December 31,2021 the average bull market has had an average total return of 99% and lasted an average of 852 days. The average bear markets have had returns of -28% and lasted 236 days. The US stock markets have always had a proclivity to go up. From time to time they go down. But more often than not and for more time than not, US markets go up. This is the “house bet” and its never a good idea to bet against the house. Let’s put a finer point on our contention that it is not a good idea to time markets. From Fidelity Investments comes the following Chart 11.k
Chart 11
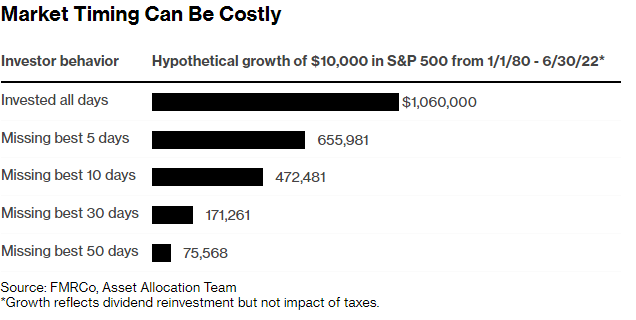
What the above demonstrates is that if an investor misses just a few important days, their investment results will be quite severely impacted. For example, if investors missed the best 5 days of a bull market their return would be 38.2% less than if they had been fully invested at all times (i.e., $655,981/$1,060,000). Similarly, if an investor had tried to call market turns and missed only the best 10 days, their return would be 55.5% less than if they had stayed the course. It seems to us (and from our own experience) that it is futile to weave dollars in and out of markets and be successful in the long run. One might get it right once in a career of investing. We would characterize that as luck. The research well demonstrates that persistence in investing wins the long race. So despite the anxiety that is swirling around investors today and tempting investors to “do something”, we think it best for investors to stay invested with the best companies they can find.
PREDICTIONS FOR 2022
- Interest rates to rise a bit in 2022. Yes – The Fed continues on its path to raise rates to stifle inflation.
- The dollar will be firm. Yes – As a result of rising interest rates, the dollar is very strong vs. other currencies.
- Corporate earnings will be strong – but not grow as fast as in 2021. Yes – So far it has been the case.
- U.S. infrastructure spending will take off. Yes – Money is starting to get spent.
- China will continue to threaten Taiwan, but not move on Taiwan. Yes – More “saber rattling” recently, but that is all.
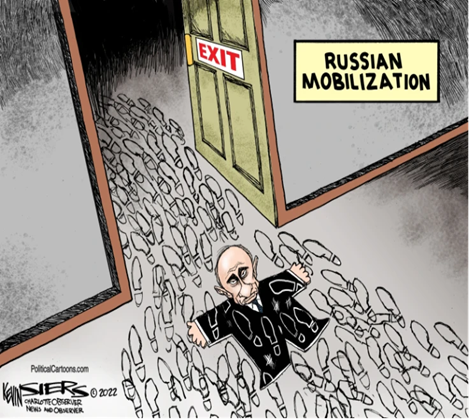
- Russia, after lots of “saber rattling”, will back away from Ukraine. No – Russia is “knee deep” in a war and not faring well so far.
- Oil will stay well priced. Yes – Oil is priced well, historically-but has seen recent weakness in pricing.
- Inflation will “simmer down” from closing 2021 levels. Yes/No – Forward looking indicators suggest inflation is headed down. But backward looking signs (CPI & PCE) do not yet reflect downward direction.
- Investor “risk appetites” will stay strong. No – Investors are “spooked.”
- U.S. stocks will continue to make progress – but more subdued than in 2021. No – A “bear” market is at hand because of #1 above.
A FINAL THOUGHT
The opinions expressed in this Commentary are those of Baldwin Investment Management, LLC. These views are subject to change at any time based on market and other conditions, and no forecasts can be guaranteed.
The reported numbers enclosed are derived from sources believed to be reliable. However, we cannot guarantee their accuracy. Past performance does not guarantee future results.
We recommend that you compare our statement with the statement that you receive from your custodian.
A list of our Proxy voting procedures is available upon request. A current copy of our ADV Part II & Privacy Policy is available upon request or at
www.baldwinmgt.com/disclosures.