
Before trying to foretell too much about the future, let’s “set the table”. Let’s see where we are economically, financially and sentimentally – then launch into what we may see. At “30,000 feet”, Bloomberg publishes the Bloomberg Financial Conditions Index which incorporates numerous financial markers that when put together in the index tell a story about the US economy.
Chart 1
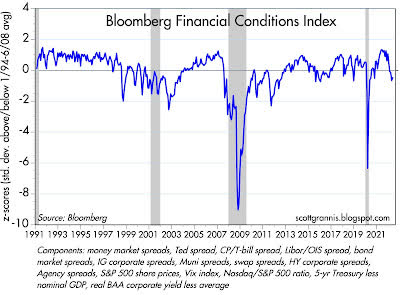
As the reader will note, there has been economic deterioration, but nothing so far which is worrisome. Look at 2009 for an example of “worrisome”. Further, in Chart 2 below, it is demonstrated that the bond market is not looking for an economic accident as “junk spreads” (the difference between investment grade and high yield debt) are not soaring.
Chart 2
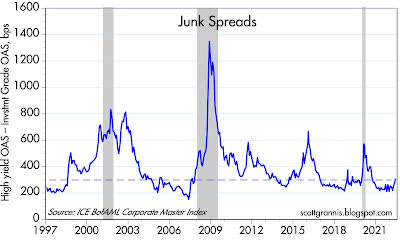
If junk spreads “blew out”, that might be an indication of impending recession. More specifically, let’s look at Chart 3, outlining the components of US Gross Domestic Product (GDP).
Chart 3
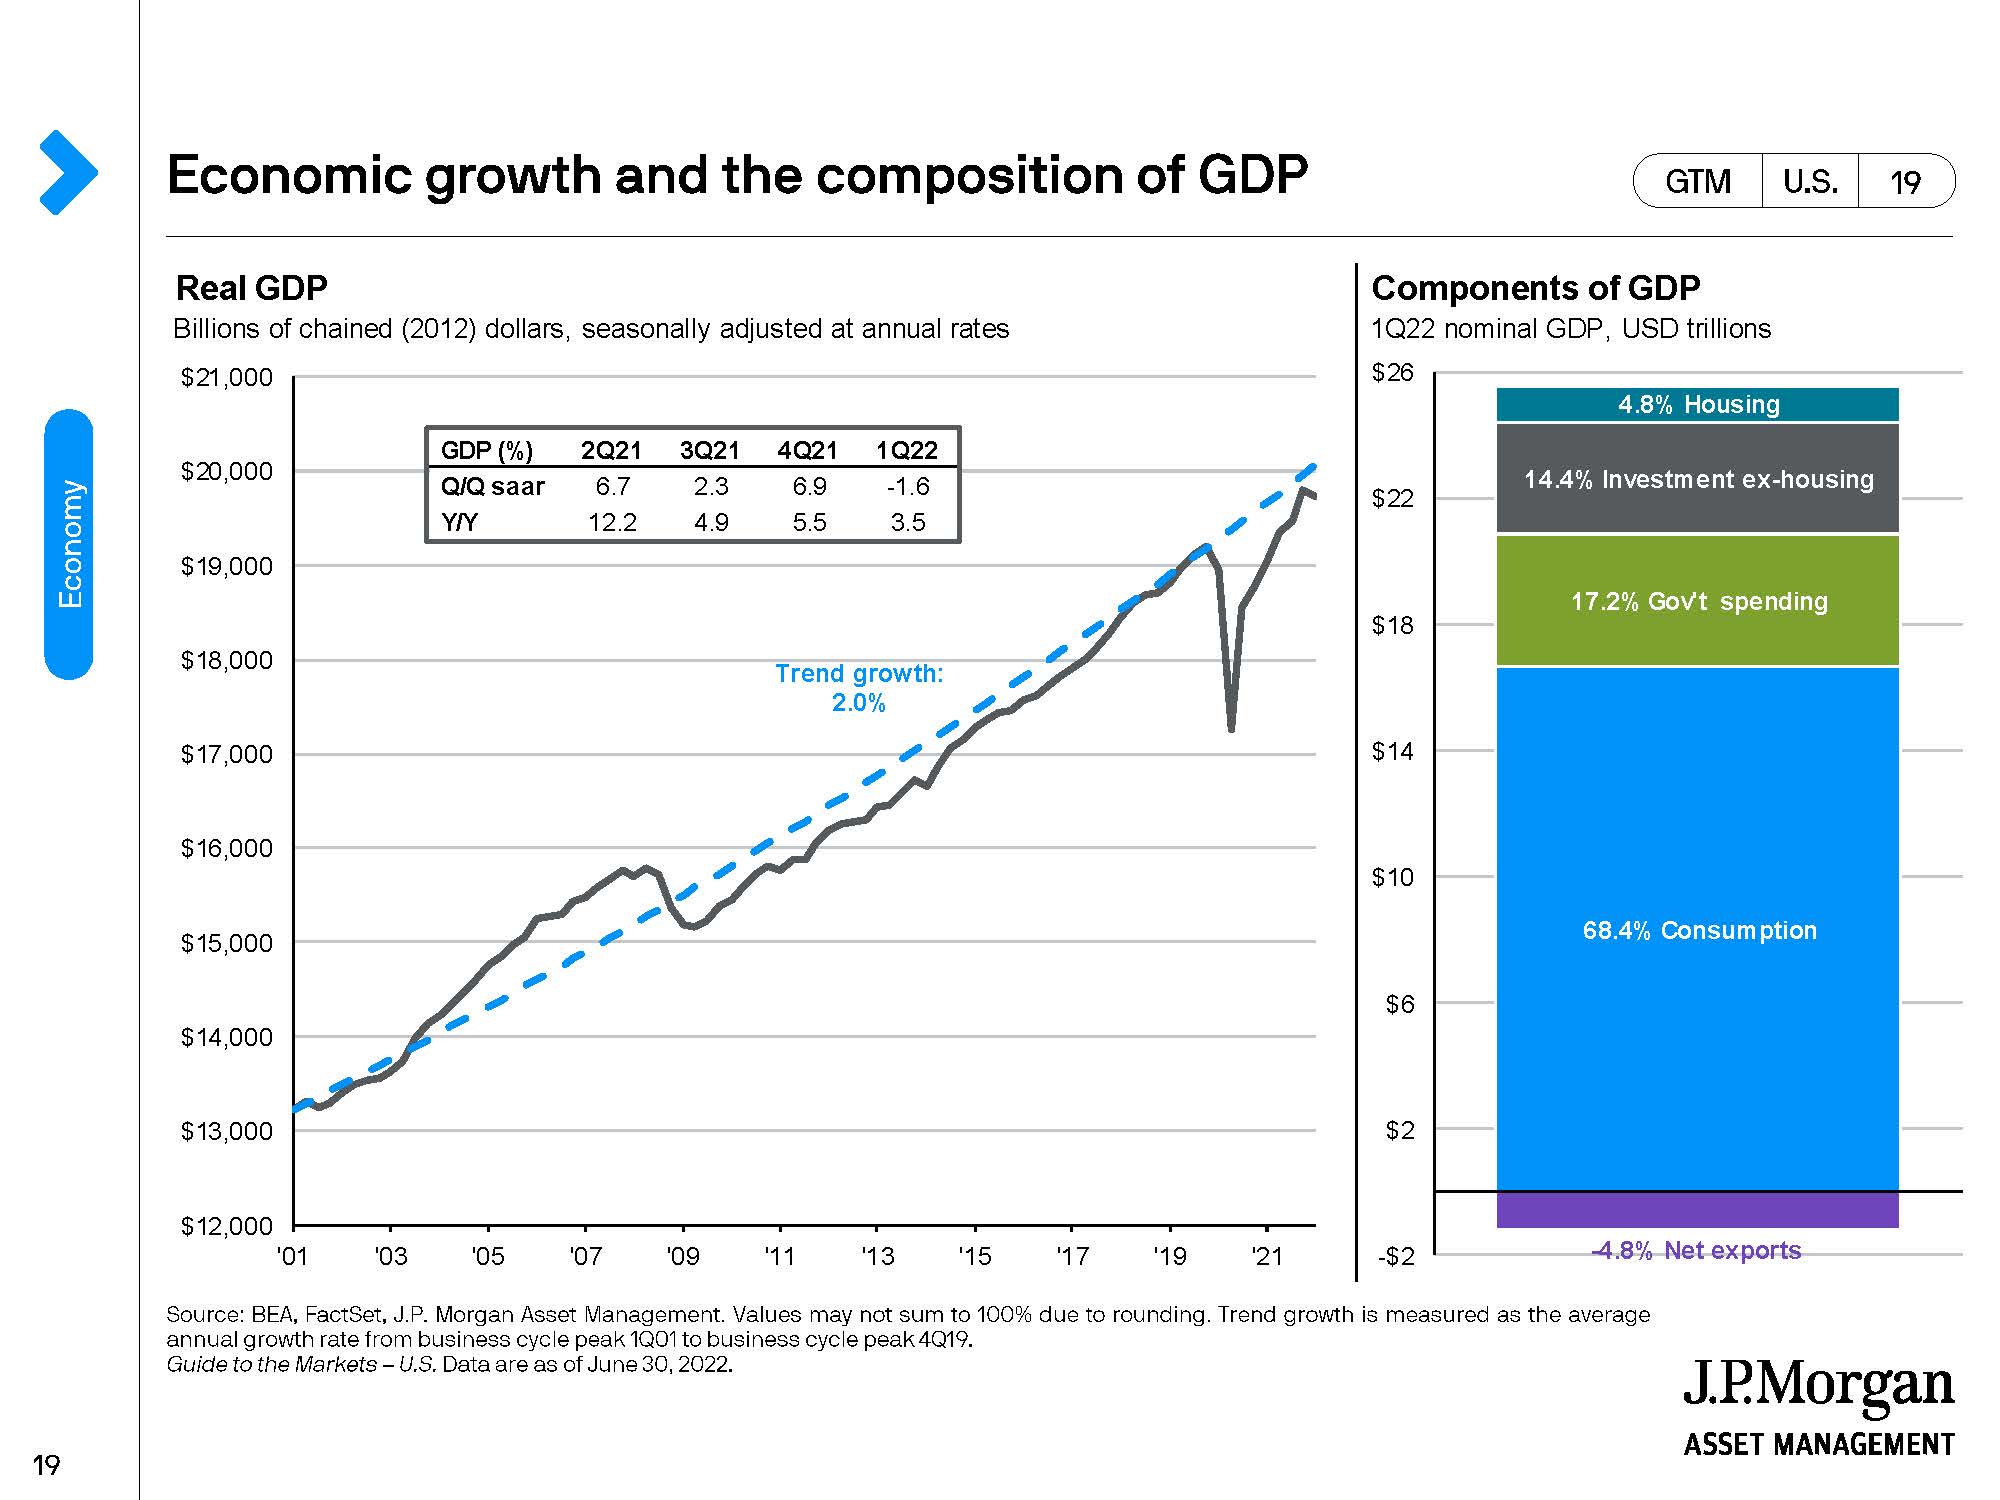
Approximately 68% of the American economy is comprised of consumption – i.e., the American consumer. As goes the American shopper, so goes the US economy. So obviously, it is very important to get a “read” on how consumers are doing and feeling.
Chart 4
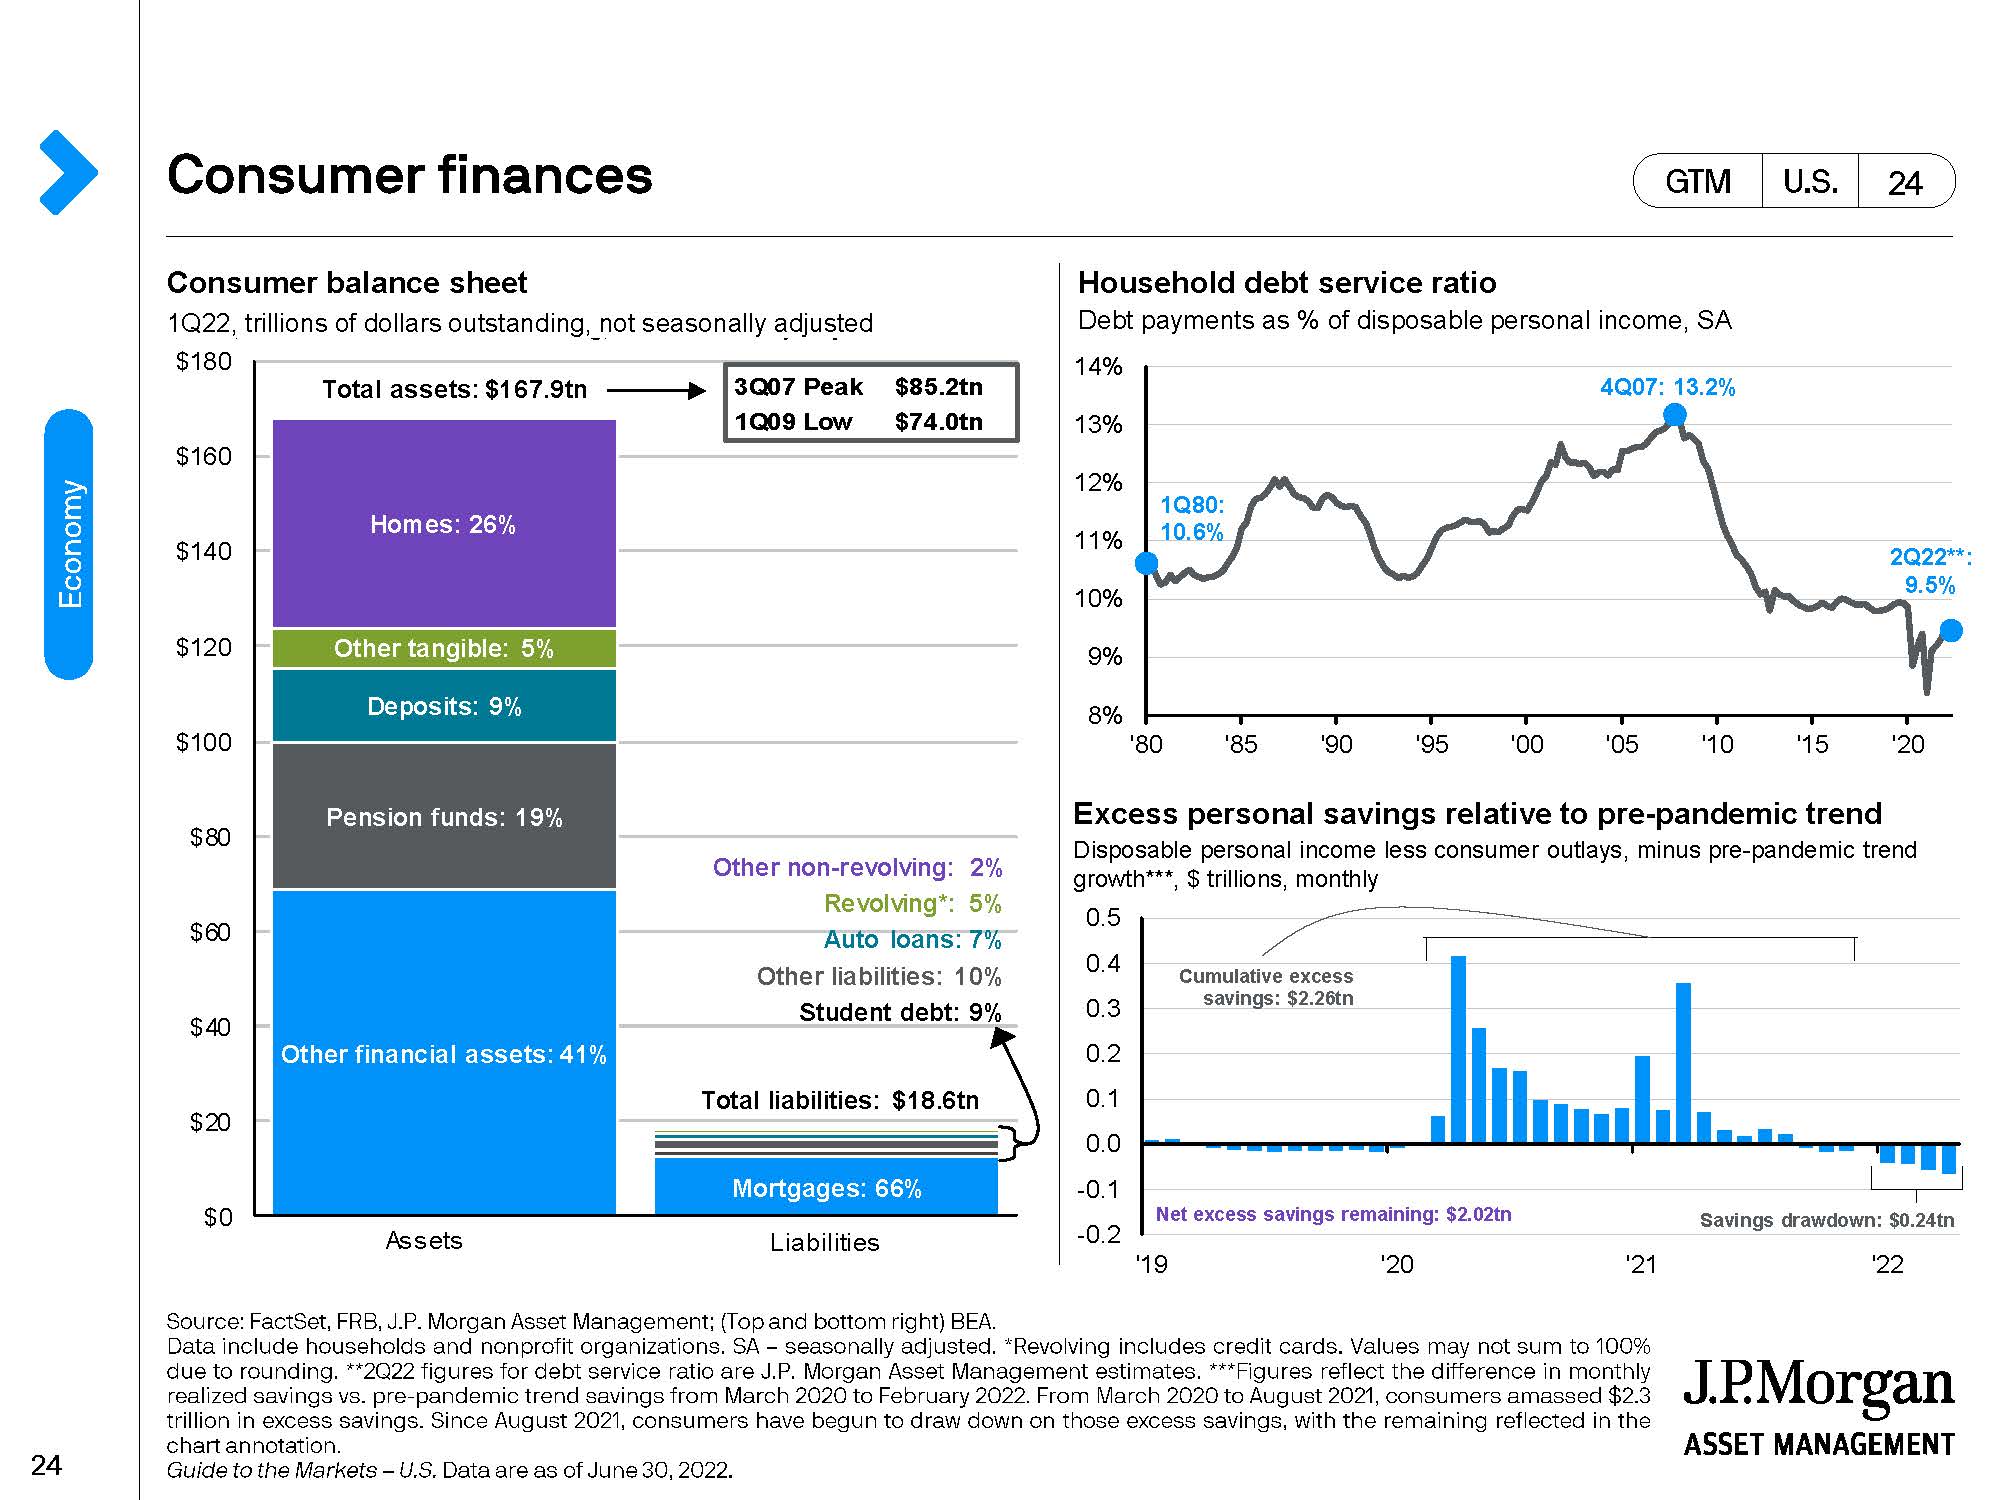
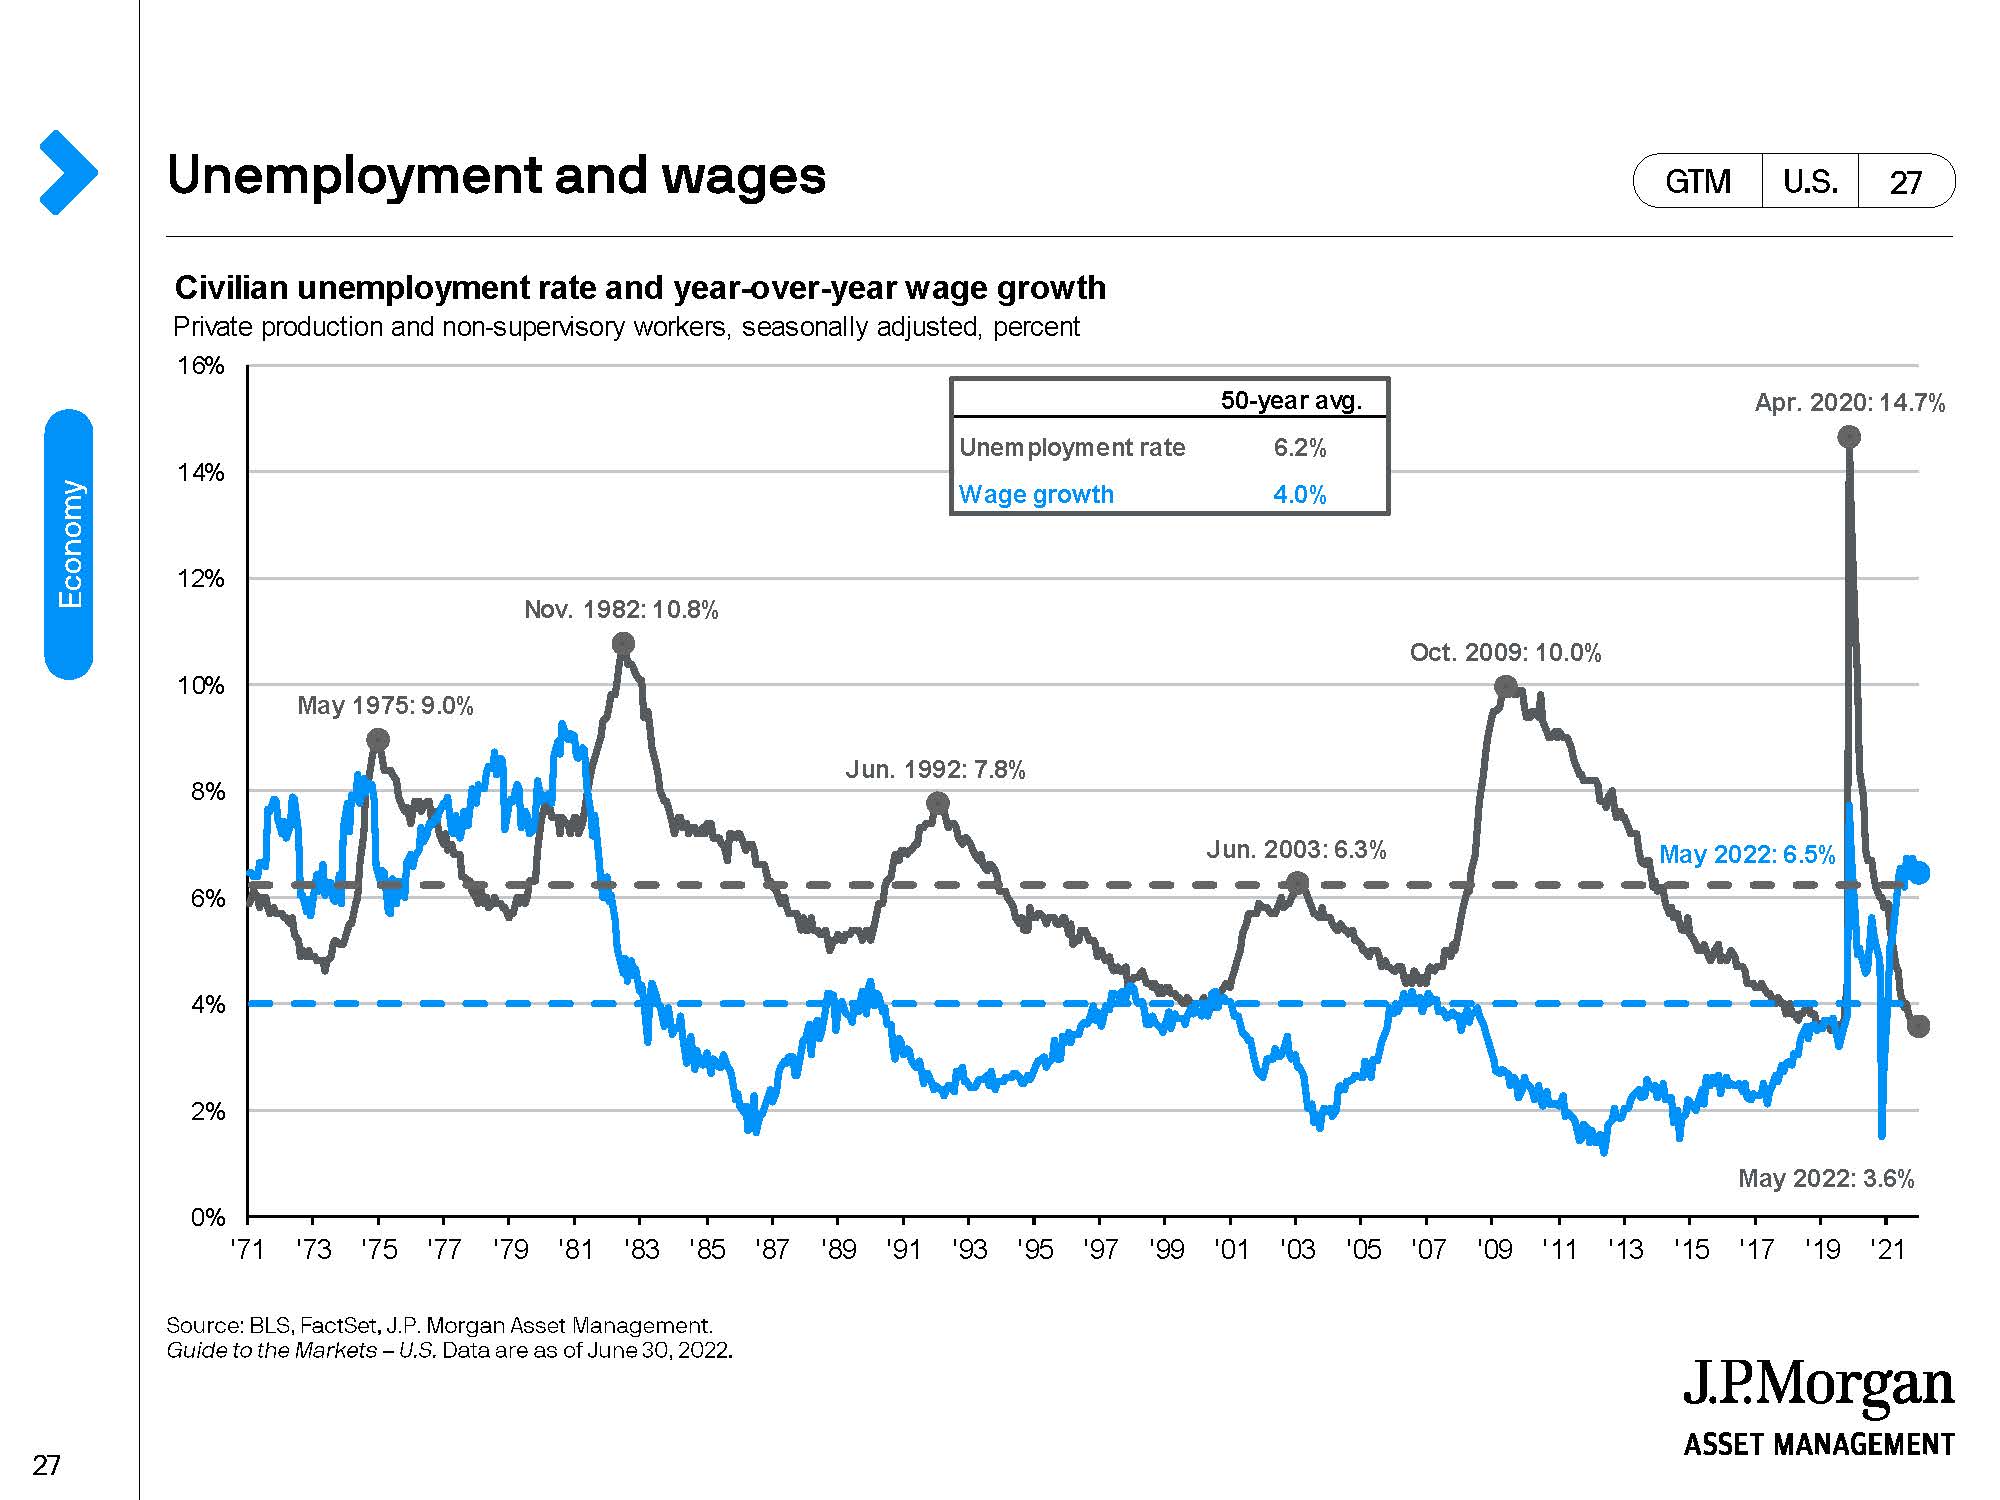
In Chart 4 above, a Consumer balance sheet as of 3/31/22 shows the American consumer with assets which are 9X the level of debts and cash which is about equal to total liabilities. Also, the debt service ratio (i.e., debt payments as a % of disposable income) is at 9.5% – near an all-time low. Next on Chart 5 it is shown that unemployment in the US is very low (3.6% and considerably below the 50-year average of 6.2%) and wages have been growing at a rate of 6.5% (above the 50-year average of 4%).
Chart 5
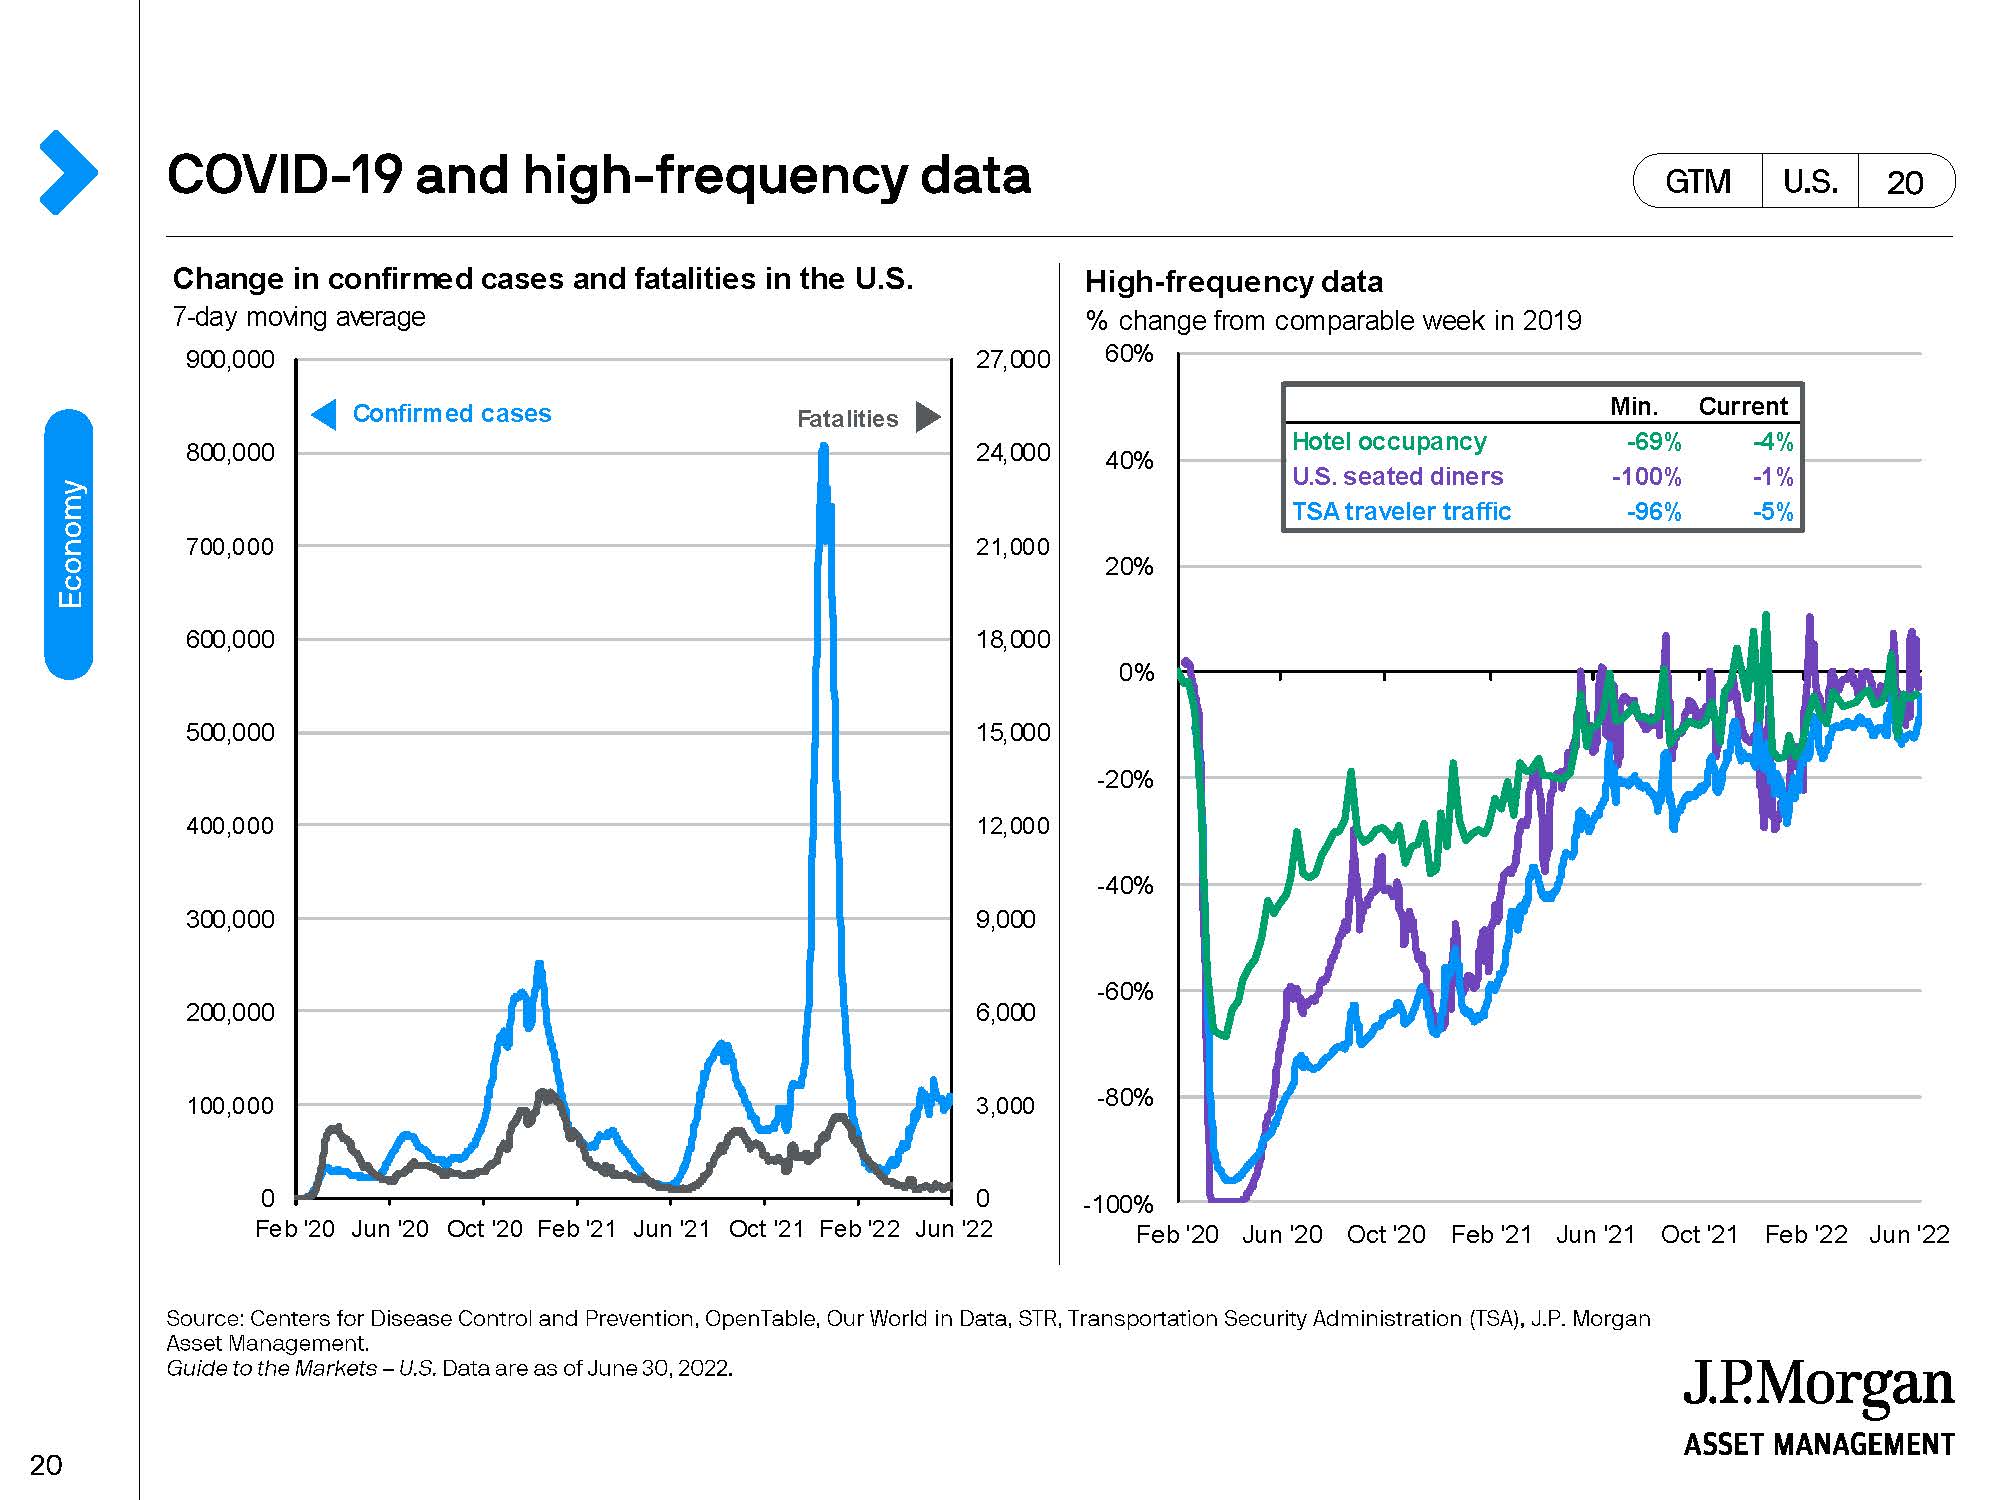
So, the American consumer is financially strong – and exhibiting that strength via high frequency data in Chart 6 through credit transactions, hotel stays, dining out and travel.
Chart 6
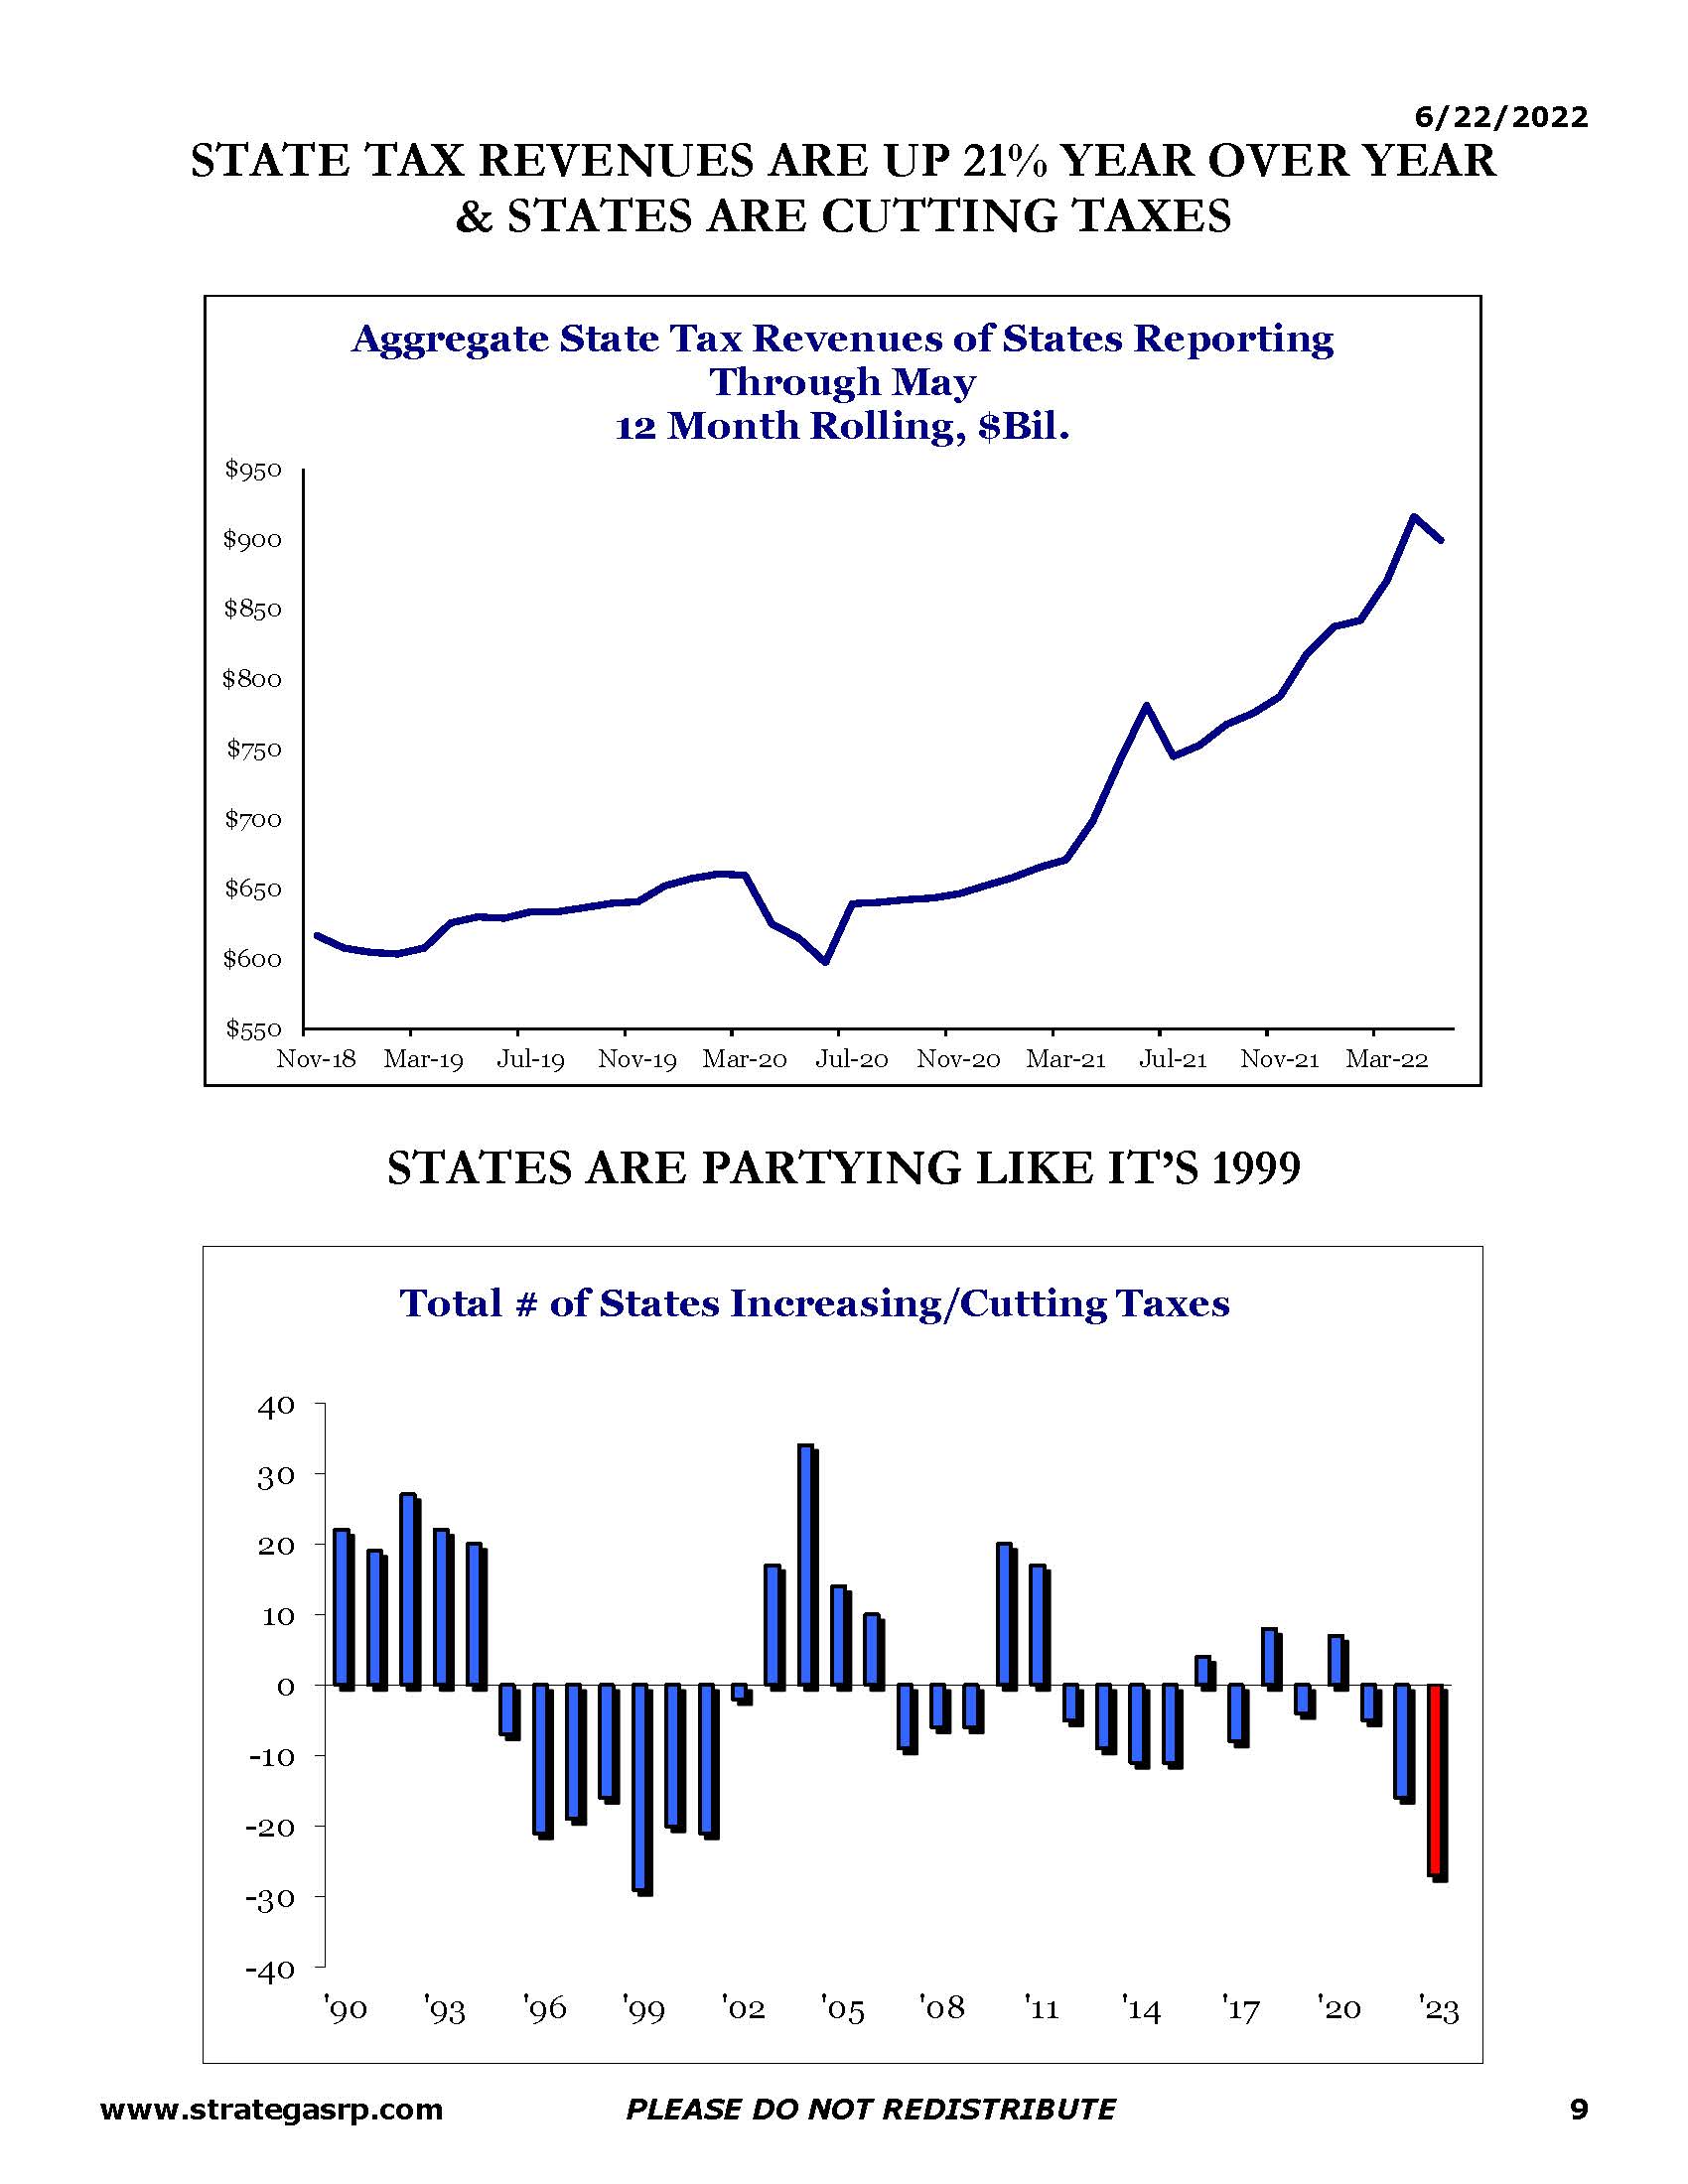
Let’s also note that other “engines” of the US economy also are strong. Corporate America just finished a year of record sales, earnings, cash flow and dividend payments to shareholders. Company balance sheets are solid. State governments have run surpluses recently and an increasing number are cutting taxes.
Chart 7
The only entity which took on quite a bit of leverage over the past couple of years is the Federal government. But they print their “own money”. Yet, all is not right. The American consumer feels terrible and this is well depicted in Chart 8 below.
Chart 8
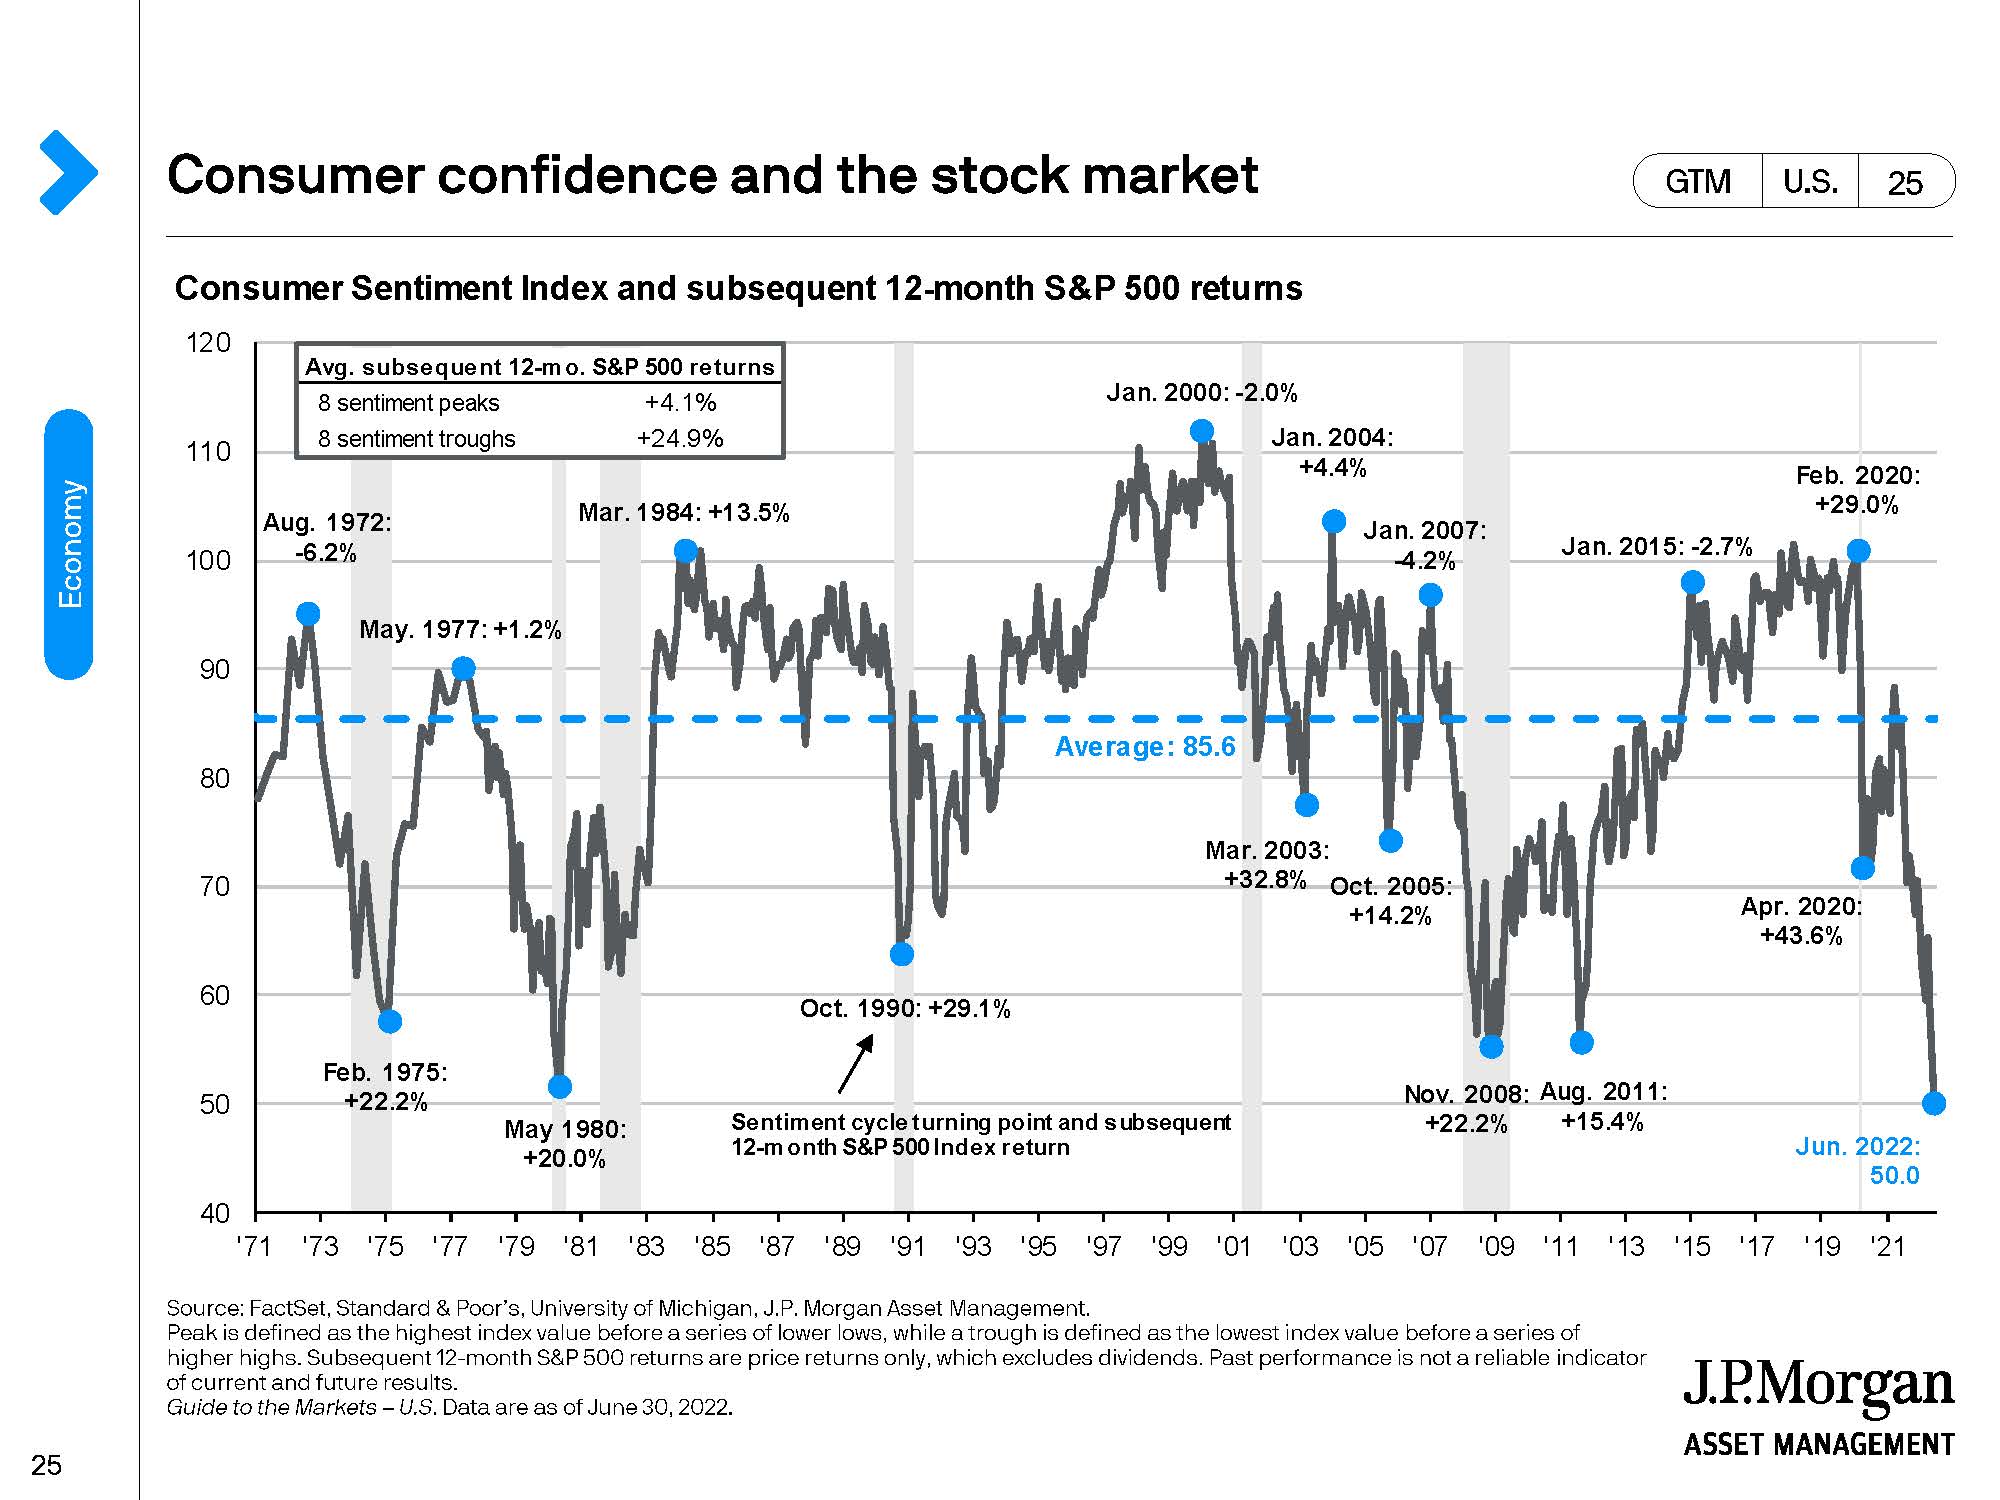
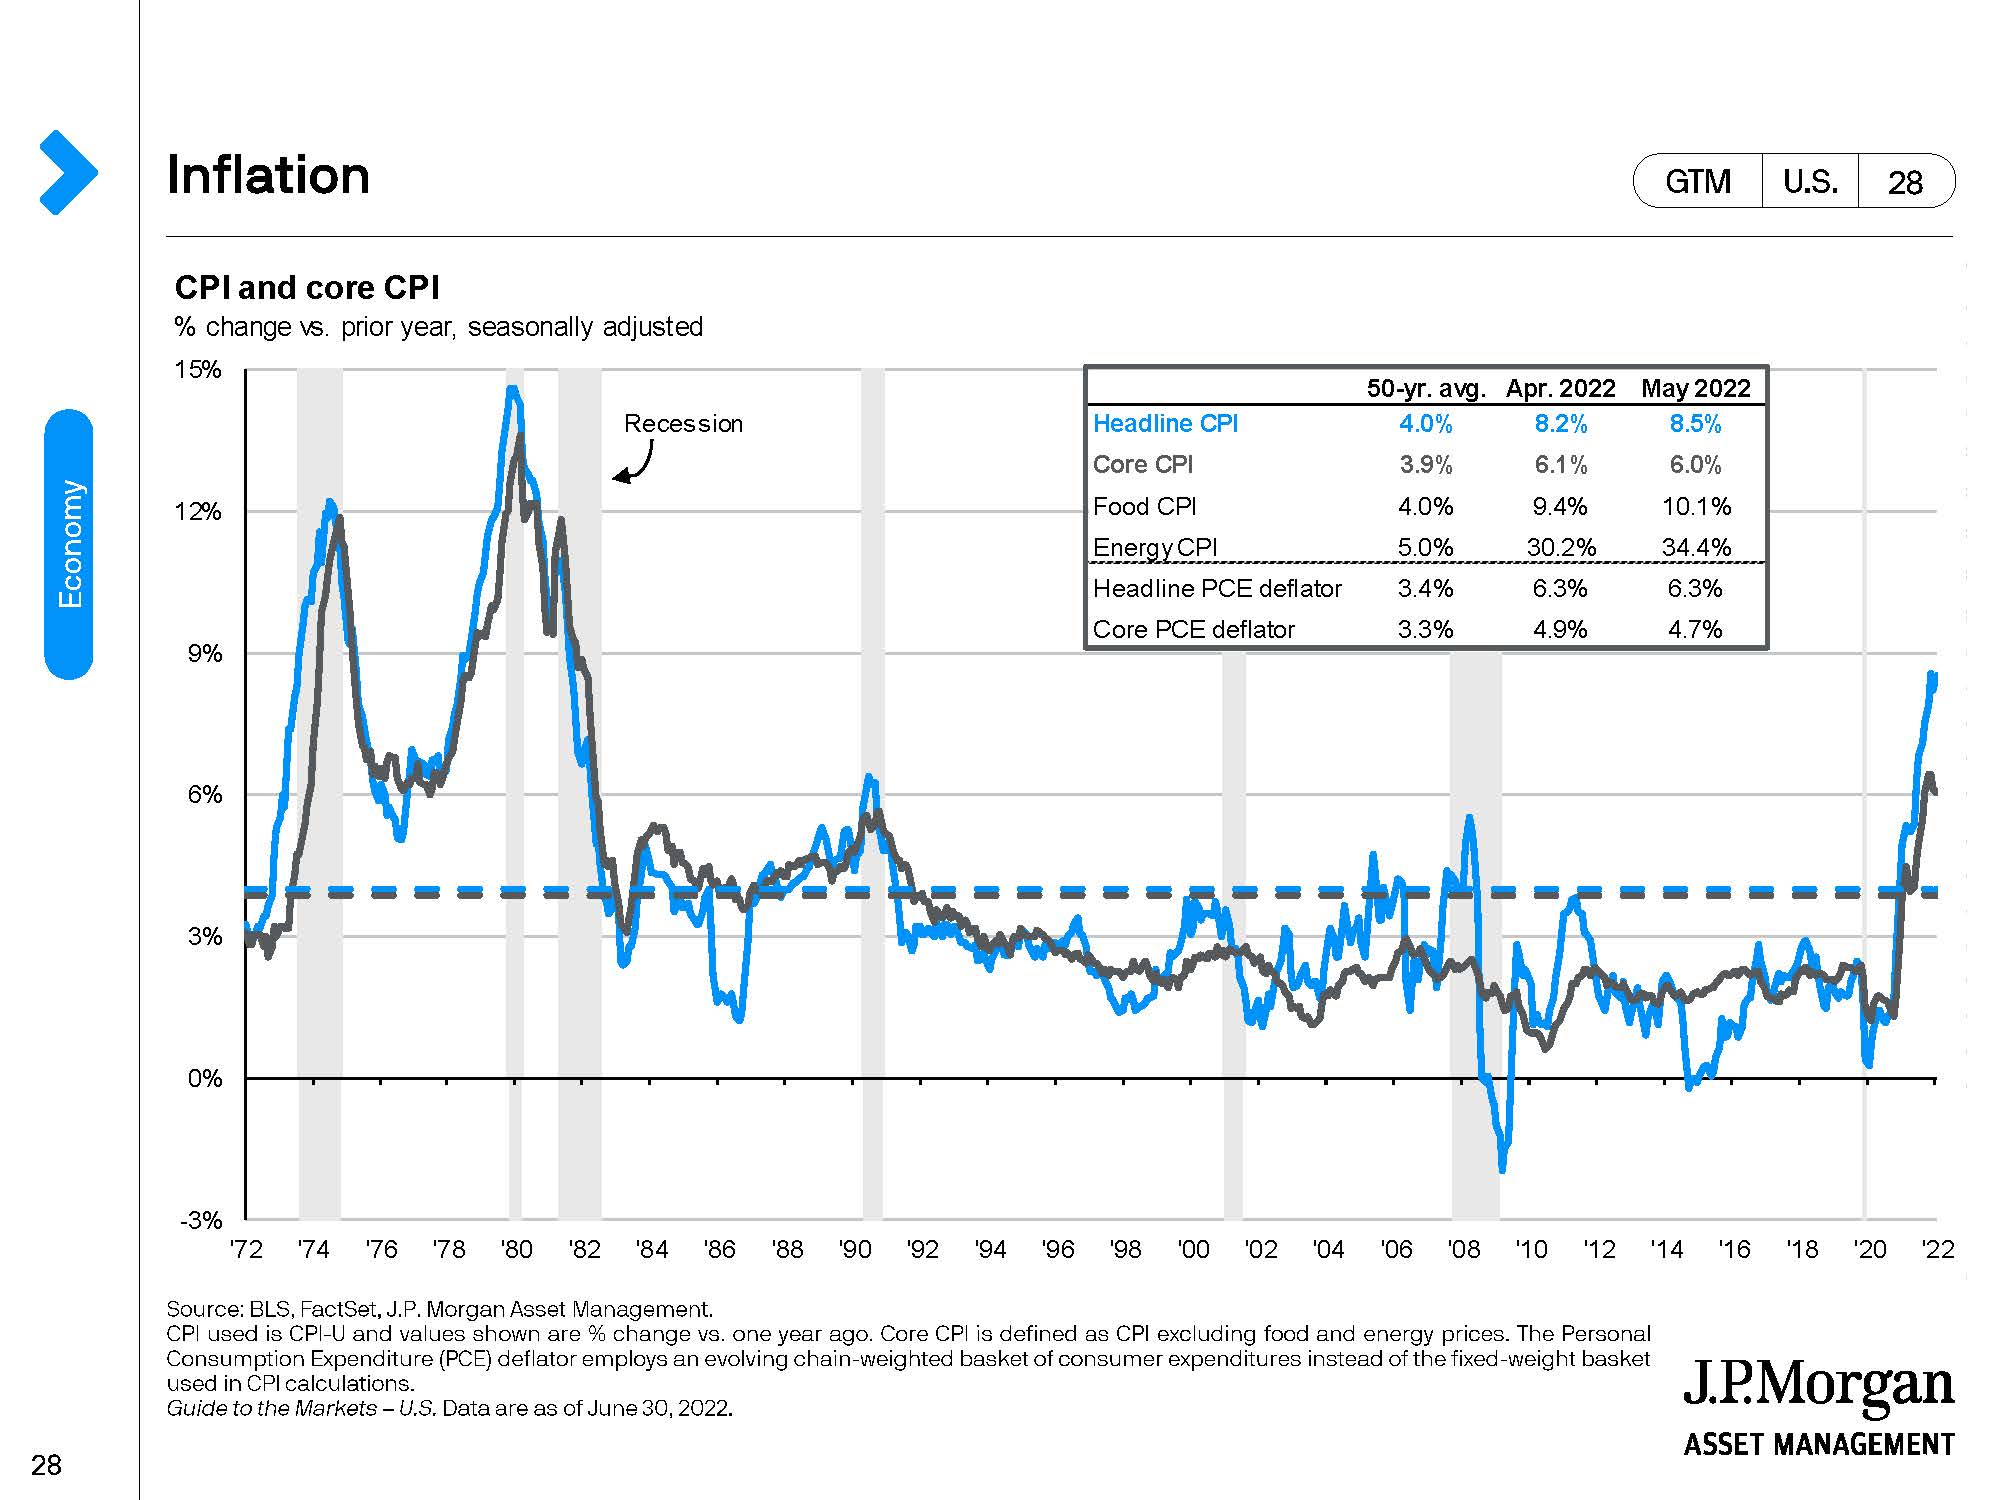
Consumer sentiment as measured by the University of Michigan is plumbing lows rarely seen over the past 50 years. While the war in Ukraine is never far from “front of mind” causing concern, inflation – a force which has been quiet for a couple decades – is the “fear” which prompts Americans to say in recent polls that the US is going in the wrong direction. Chart 9 demonstrates the recent surprising jump in US inflation, as measured by the Consumer Price Index (CPI).
Chart 9
Certainly, supply chain pressures (see Chart 10) have contributed to the inflation “heat”.
Chart 10
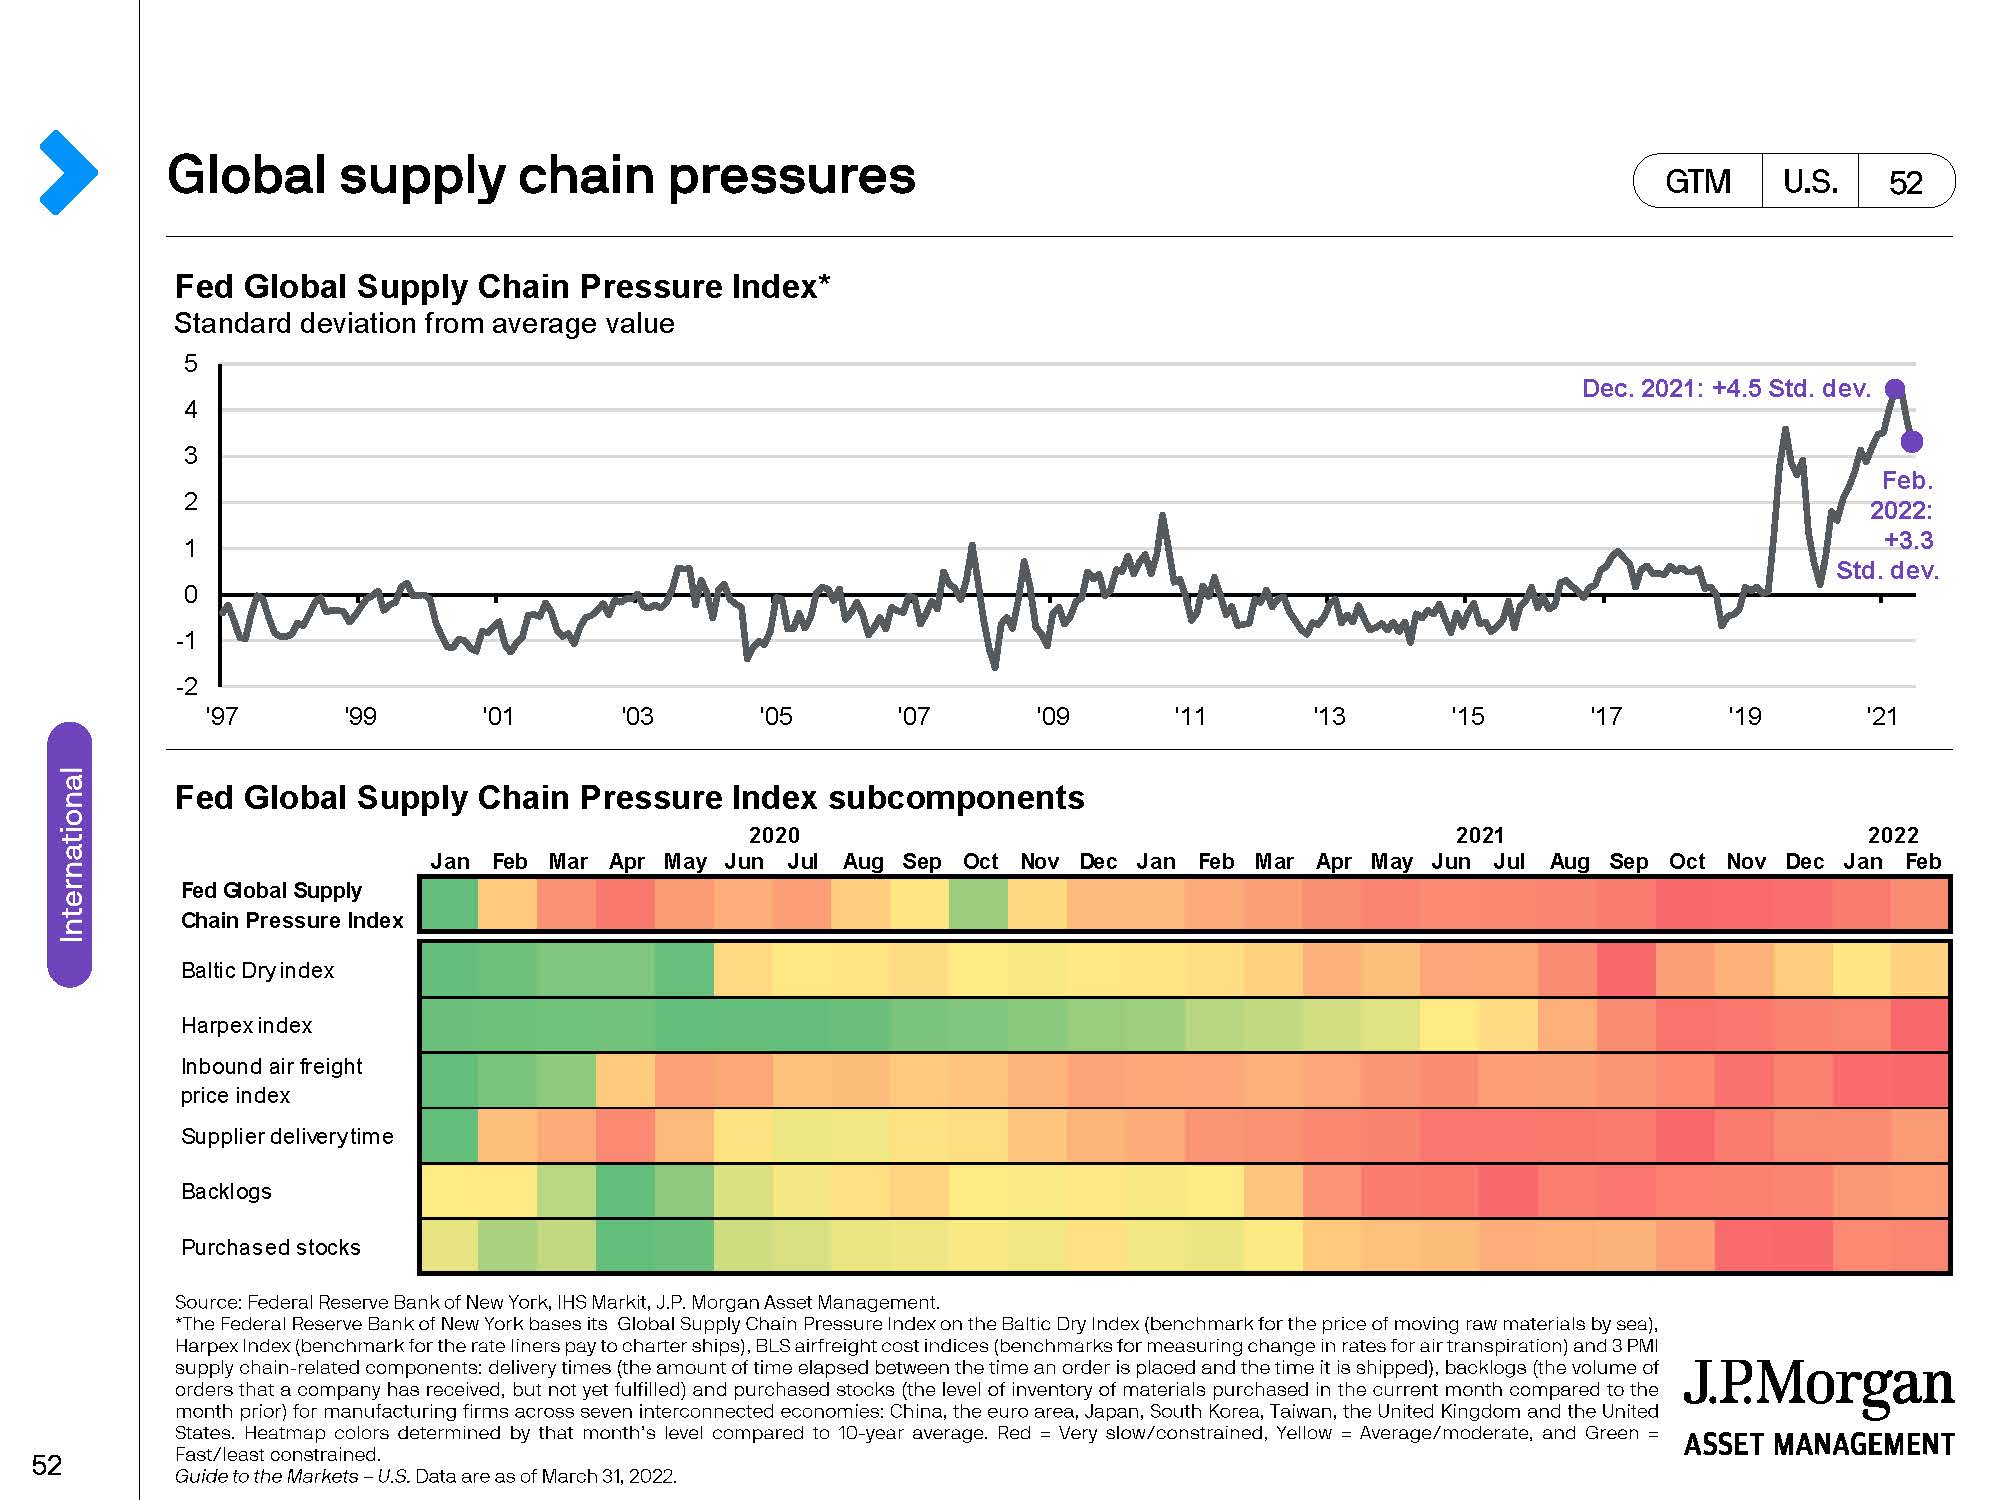
Emerging from Covid, it seemed as though the world had lost its ability to seamlessly transport goods around the globe as once happened. China, in particular, has struggled with its exit from the pandemic. Responding to local outbreaks of the disease with strict lockdowns for extended periods of time has mightily disrupted production of goods and logistics. Unfortunately for the world, China has become over the past several decades the production center of choice for too many goods. So as China is disrupted, it disrupts the world and the disruption has created logistical inefficiencies which have increased costs, adding to inflation. Covid not only scrambled logistics, but also upended business around the U.S.A. and the world. As hospitals filled, business struggled to “hold on”. To help, the Federal government pushed trillions of dollars into the economy, dramatically expanding transfer payments and the Federal budget deficit to approximately $4 trillion. This expenditure eventually got monetized and has been a powerful force spurring inflation. Essentially to support the economy, the government printed money disbursed through various programs which compensated people so they could pay their rent and buy food even though they were not working. While the ballooning of the Federal deficit was highly expansionary and has pushed inflation, that is now done. The Federal deficit has come way down as can be seen in Chart 11 and this severe reduction in the deficit should act as a powerful dampener on inflation.
Chart 11
Energy (think oil and natural gas) prices have also contributed to inflation.
Chart 12
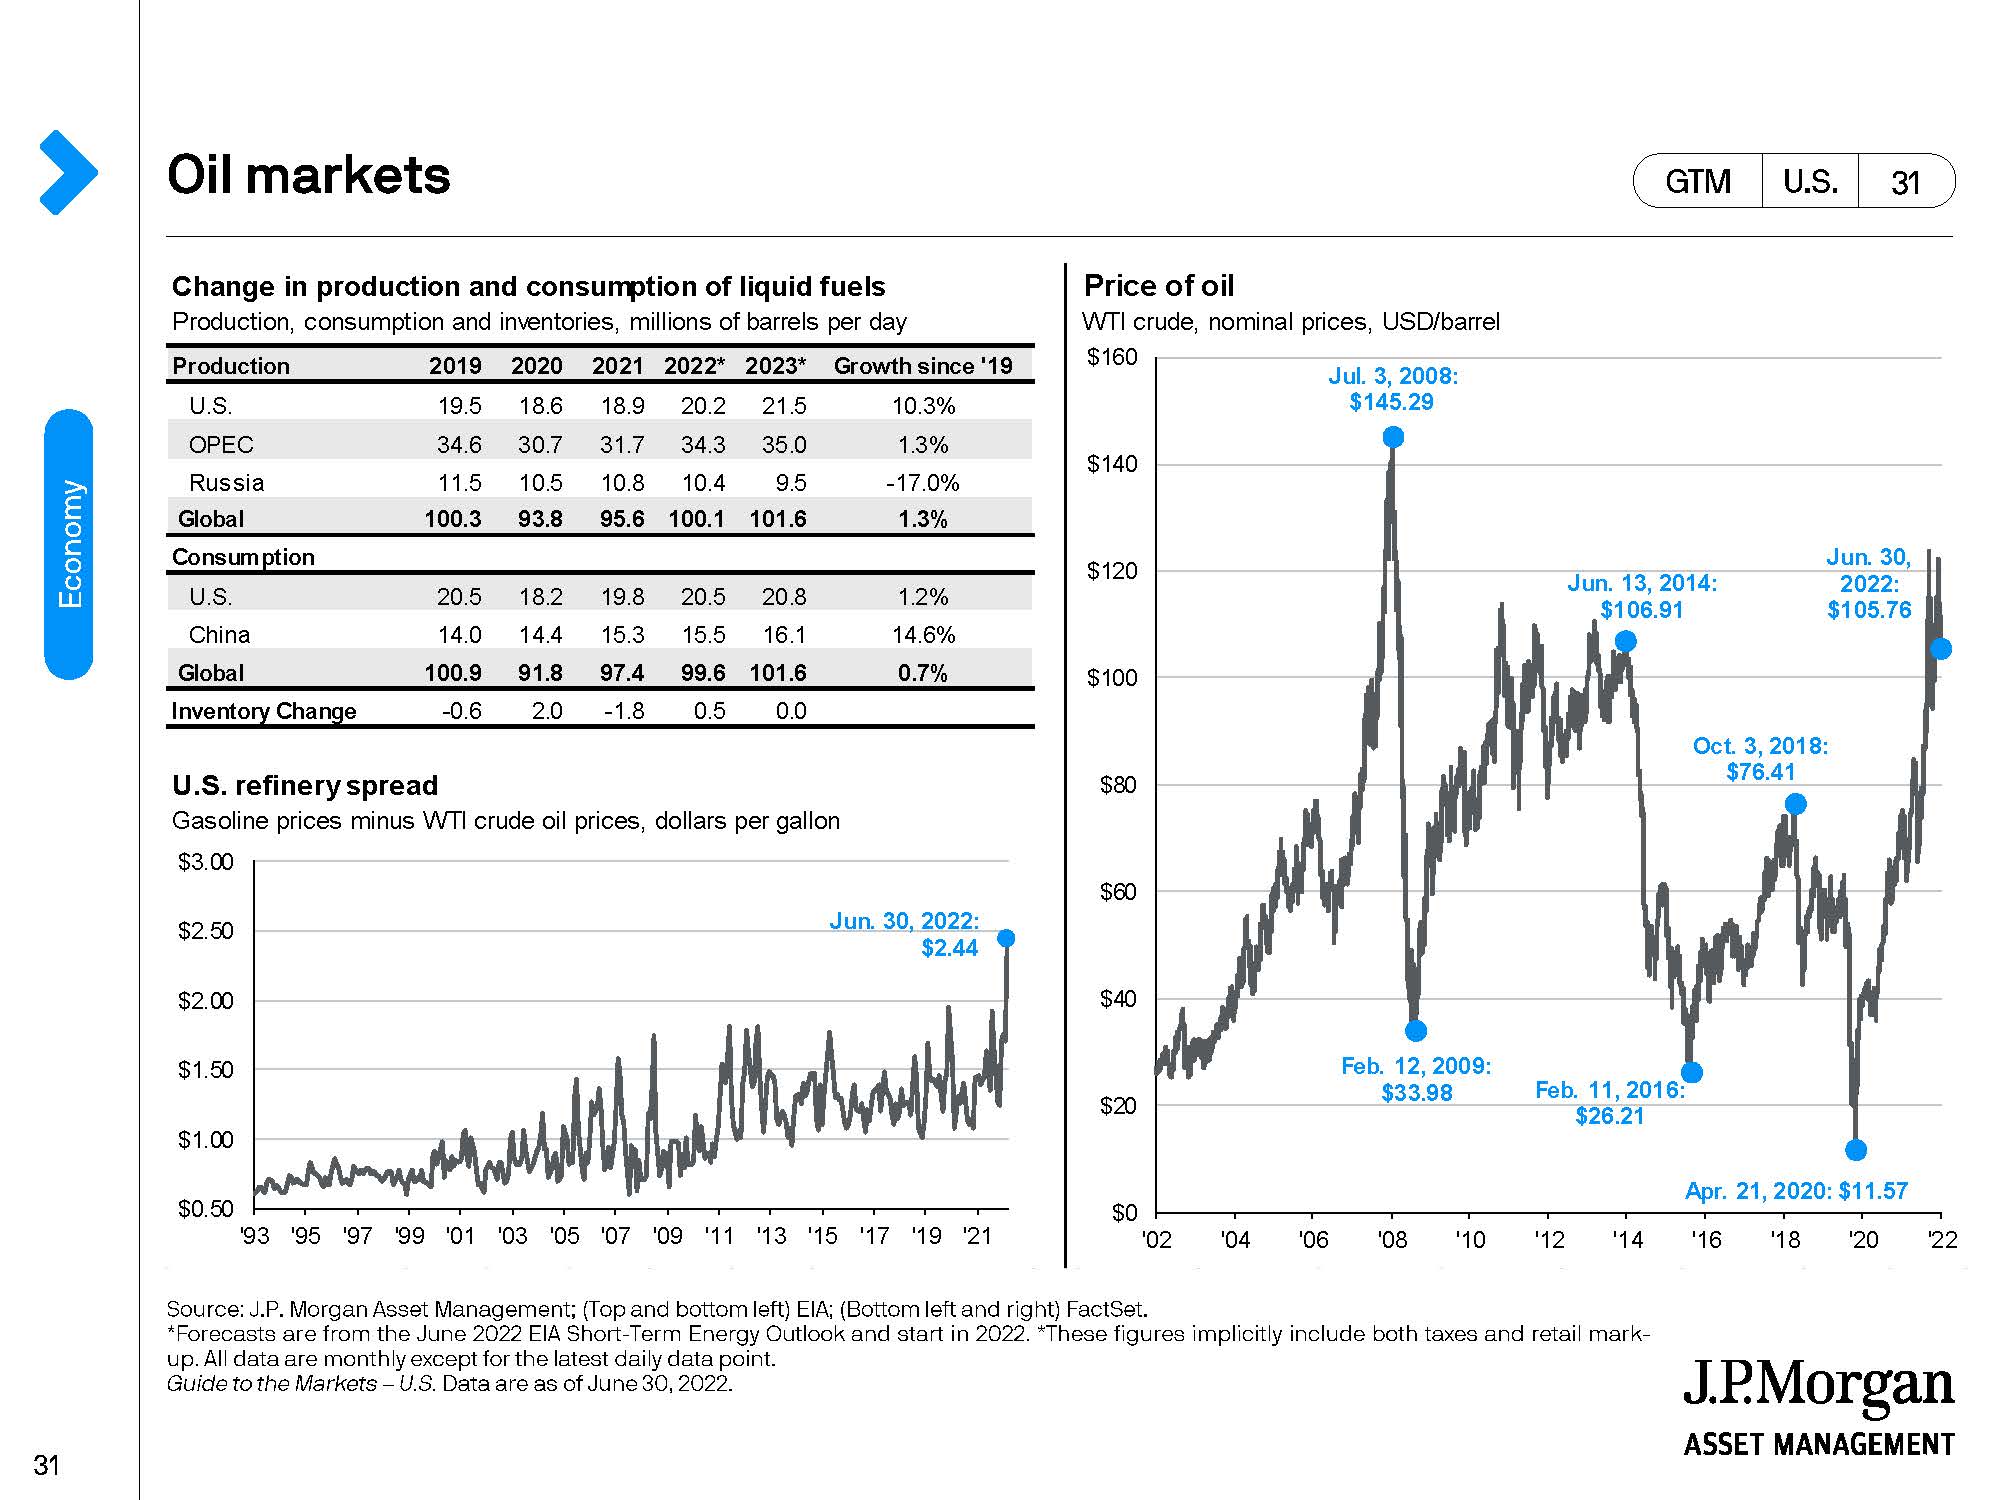
Briefly, oil prices touched $120/barrel. They are currently closer to $100. Please note that oil prices have not set new records (that was done in 2008 at $145/bbl) and more recently have risen from lows set in 2020 at $11/bbl and where in the futures markets the price of oil was actually negative for the first time in the history of trading. The point is that the “inflation rate” measures not the absolute level of a commodity or service, but its rate of change. Oil is contributing to inflation today, but it is not at a record level. Quickly look back at Chart 5 with regard to wage growth. The May year over year wage growth rate was 6.5%; 62.5% higher than the 50-year average. If this sort of compensation acceleration got embedded in people’s outlook, then inflation would become a particularly difficult issue. So let’s take a look at the components of inflation as measured by the CPI.
Chart 13
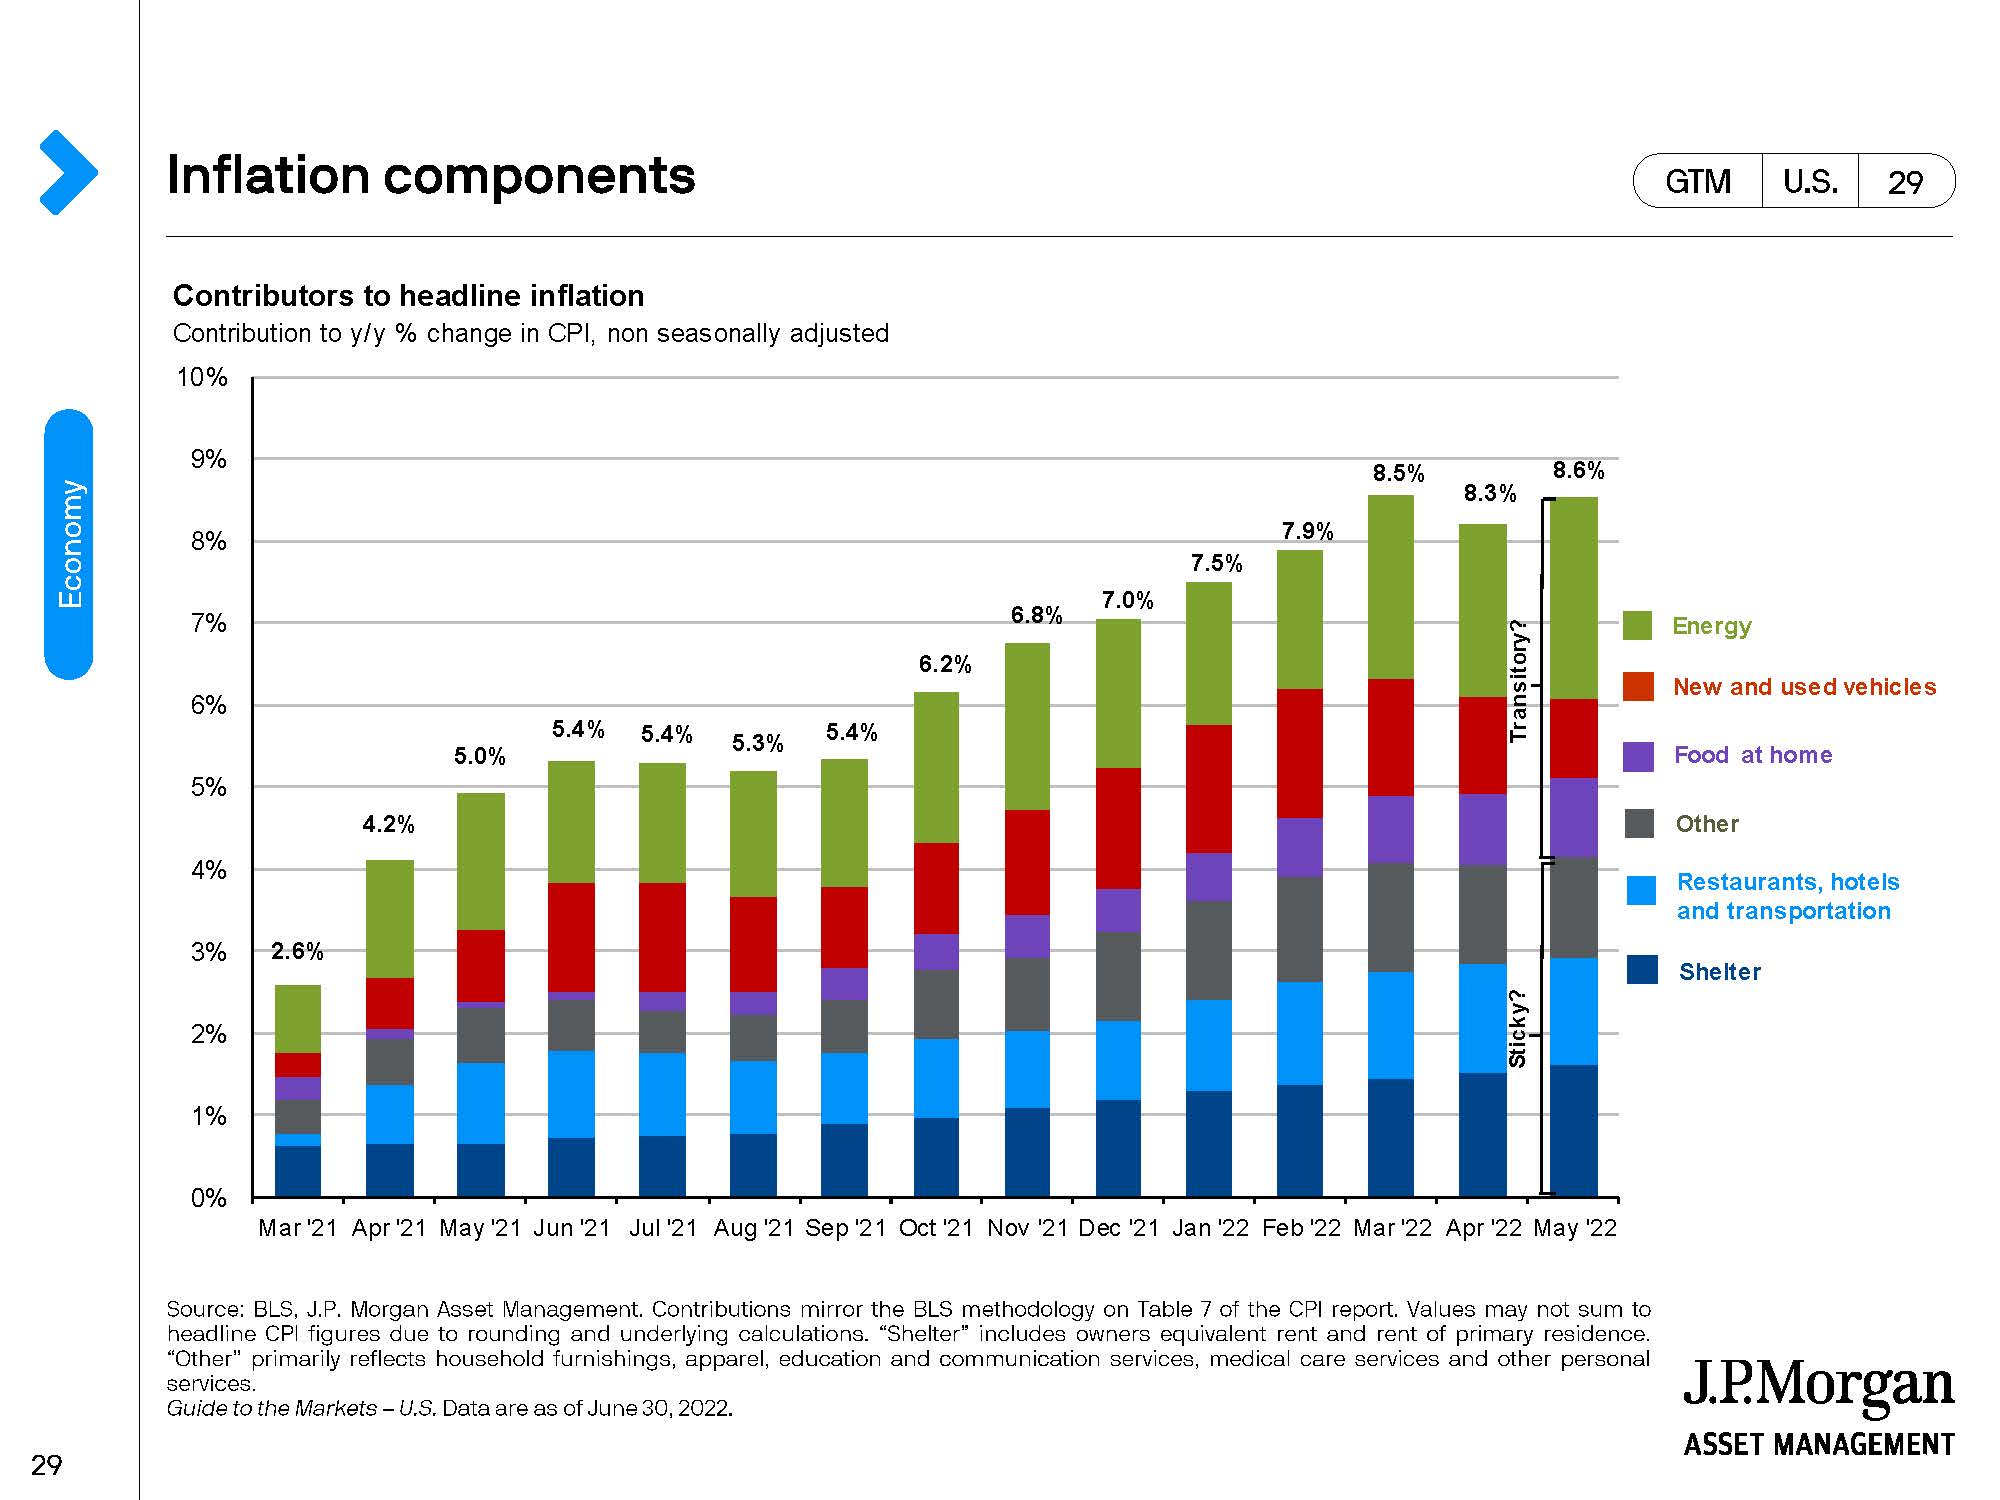
To the far right of the above chart, the reader will note the CPI being broken down as to whether parts of it are “sticky” or “transitory”. Energy, new and used vehicles and food at home are characterized as transitory – i.e., these are components of inflation that will not remain at elevated levels for long. Certainly, we have already seen a break in energy prices as noted earlier and from Chart 12 we know that oil prices are volatile and can be a lot lower than they are today. With automobile production picking up because supply issues have been corrected, car prices have softened. Food is still a problem and in particular grains like wheat are in short supply as Ukraine (4th largest supplier in the world) has not been able to export all of its wheat inventory due to the war with Russia. But the Bloomberg Agricultural Spot Index (tracking prices of farm commodities like wheat, soybean oil and sugar) has returned to levels seen just before the Russian invasion of Ukraine. The cost of shelter has increased mightily over the past several years. That run looks to be broken as a recent doubling of 30-year mortgage rates from 3% to 6% on top of sky-high real estate prices has forced potential buyers to step back, sellers to cut prices and brokers to lay off agents. Right now, business in hotels, restaurants and on planes is booming. A Covid “snapback” – a strong desire to eat out or take a trip – has redirected consumer spending from “things” to services. We suspect that this will settle down in the relatively near future. How many trips can one take?
So the Fed (i.e., the Federal Reserve Bank) has been forced to act more decisively than it had been. The “straw that broke the camel’s back” was consumer expectations that inflation was not going to get down to the Fed’s target of 2% anytime soon. In other words, too high inflation expectations were getting embedded into consumer psychology and the Fed will not allow this. So, a key interest rate controlled by the Fed was raised by 75bps (basis points) in June and similar interest rate increases were signaled for upcoming Fed meetings this summer and fall. Higher interest rates mean more expensive money and more expensive money will reduce demand for goods/services and slow down the economy. This should in turn reduce inflationary pressures. The major economic risk, as it always is when the Fed raises interest rates, is that the Fed goes too far and pushes the economy into recession. This is the psychological battle that is going on in the markets right now – will there be a Fed induced recession or not?
So if we are on a trip governed by rate hikes by the Fed, what has been the stock market’s reaction to this in the past? For perspective on this, please look at Chart 14.
Chart 14
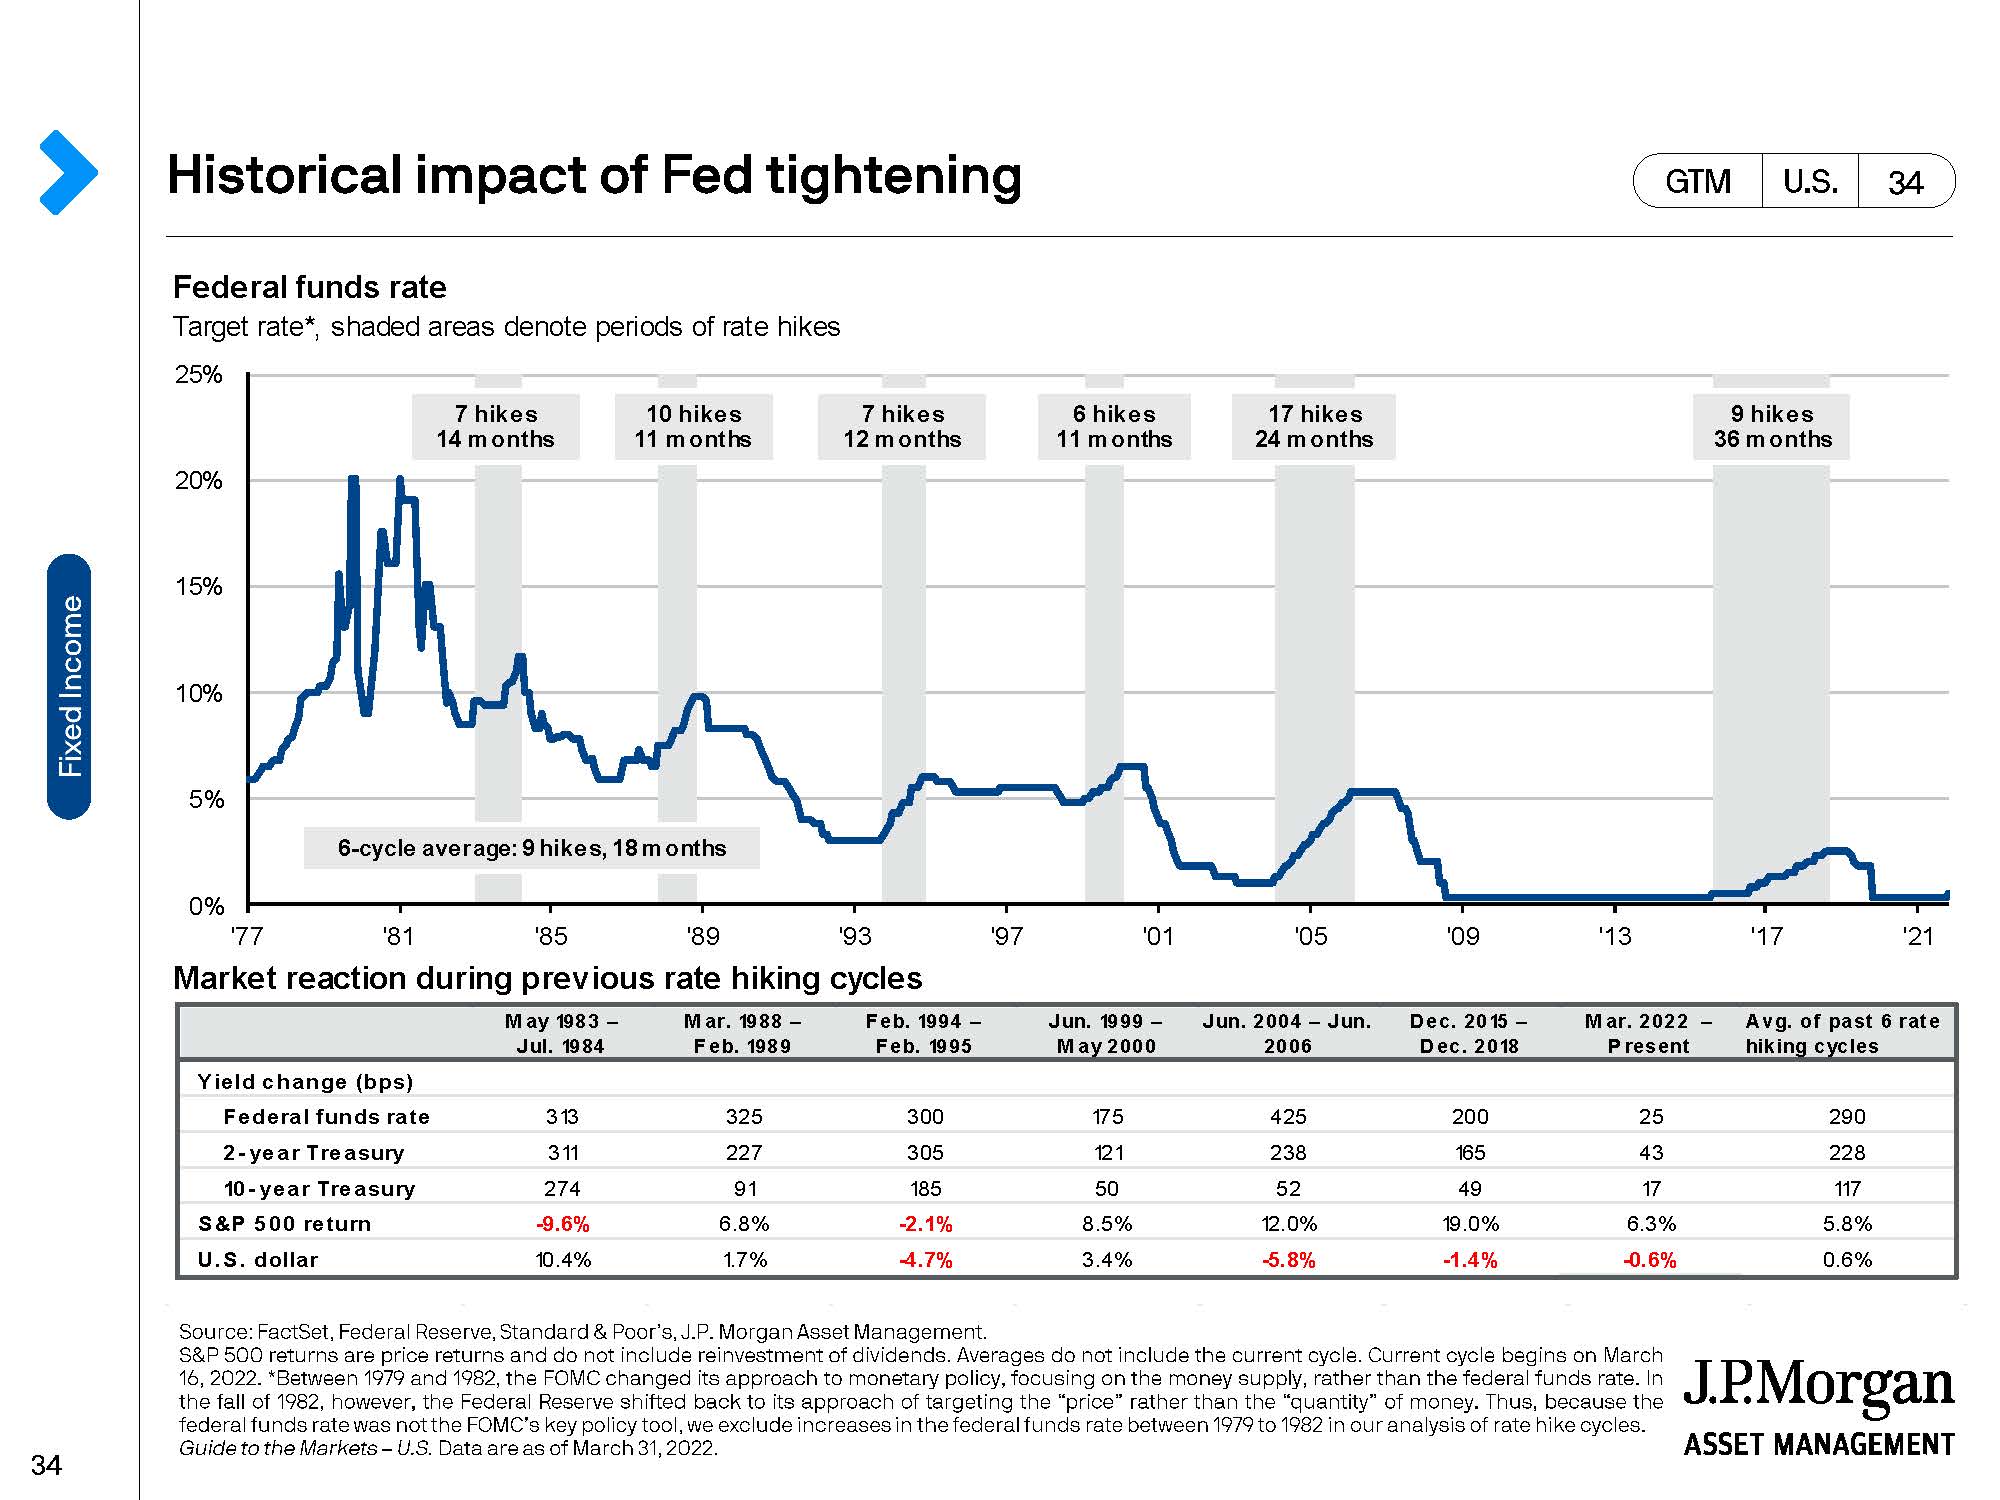
Above, the reader will see that since 1977 there have been 6 cycles of interest rate hiking. In each cycle there were a different number of rate hikes and over different lengths of time. The S&P 500 was up 67% of the time with an average return of 5.8%.
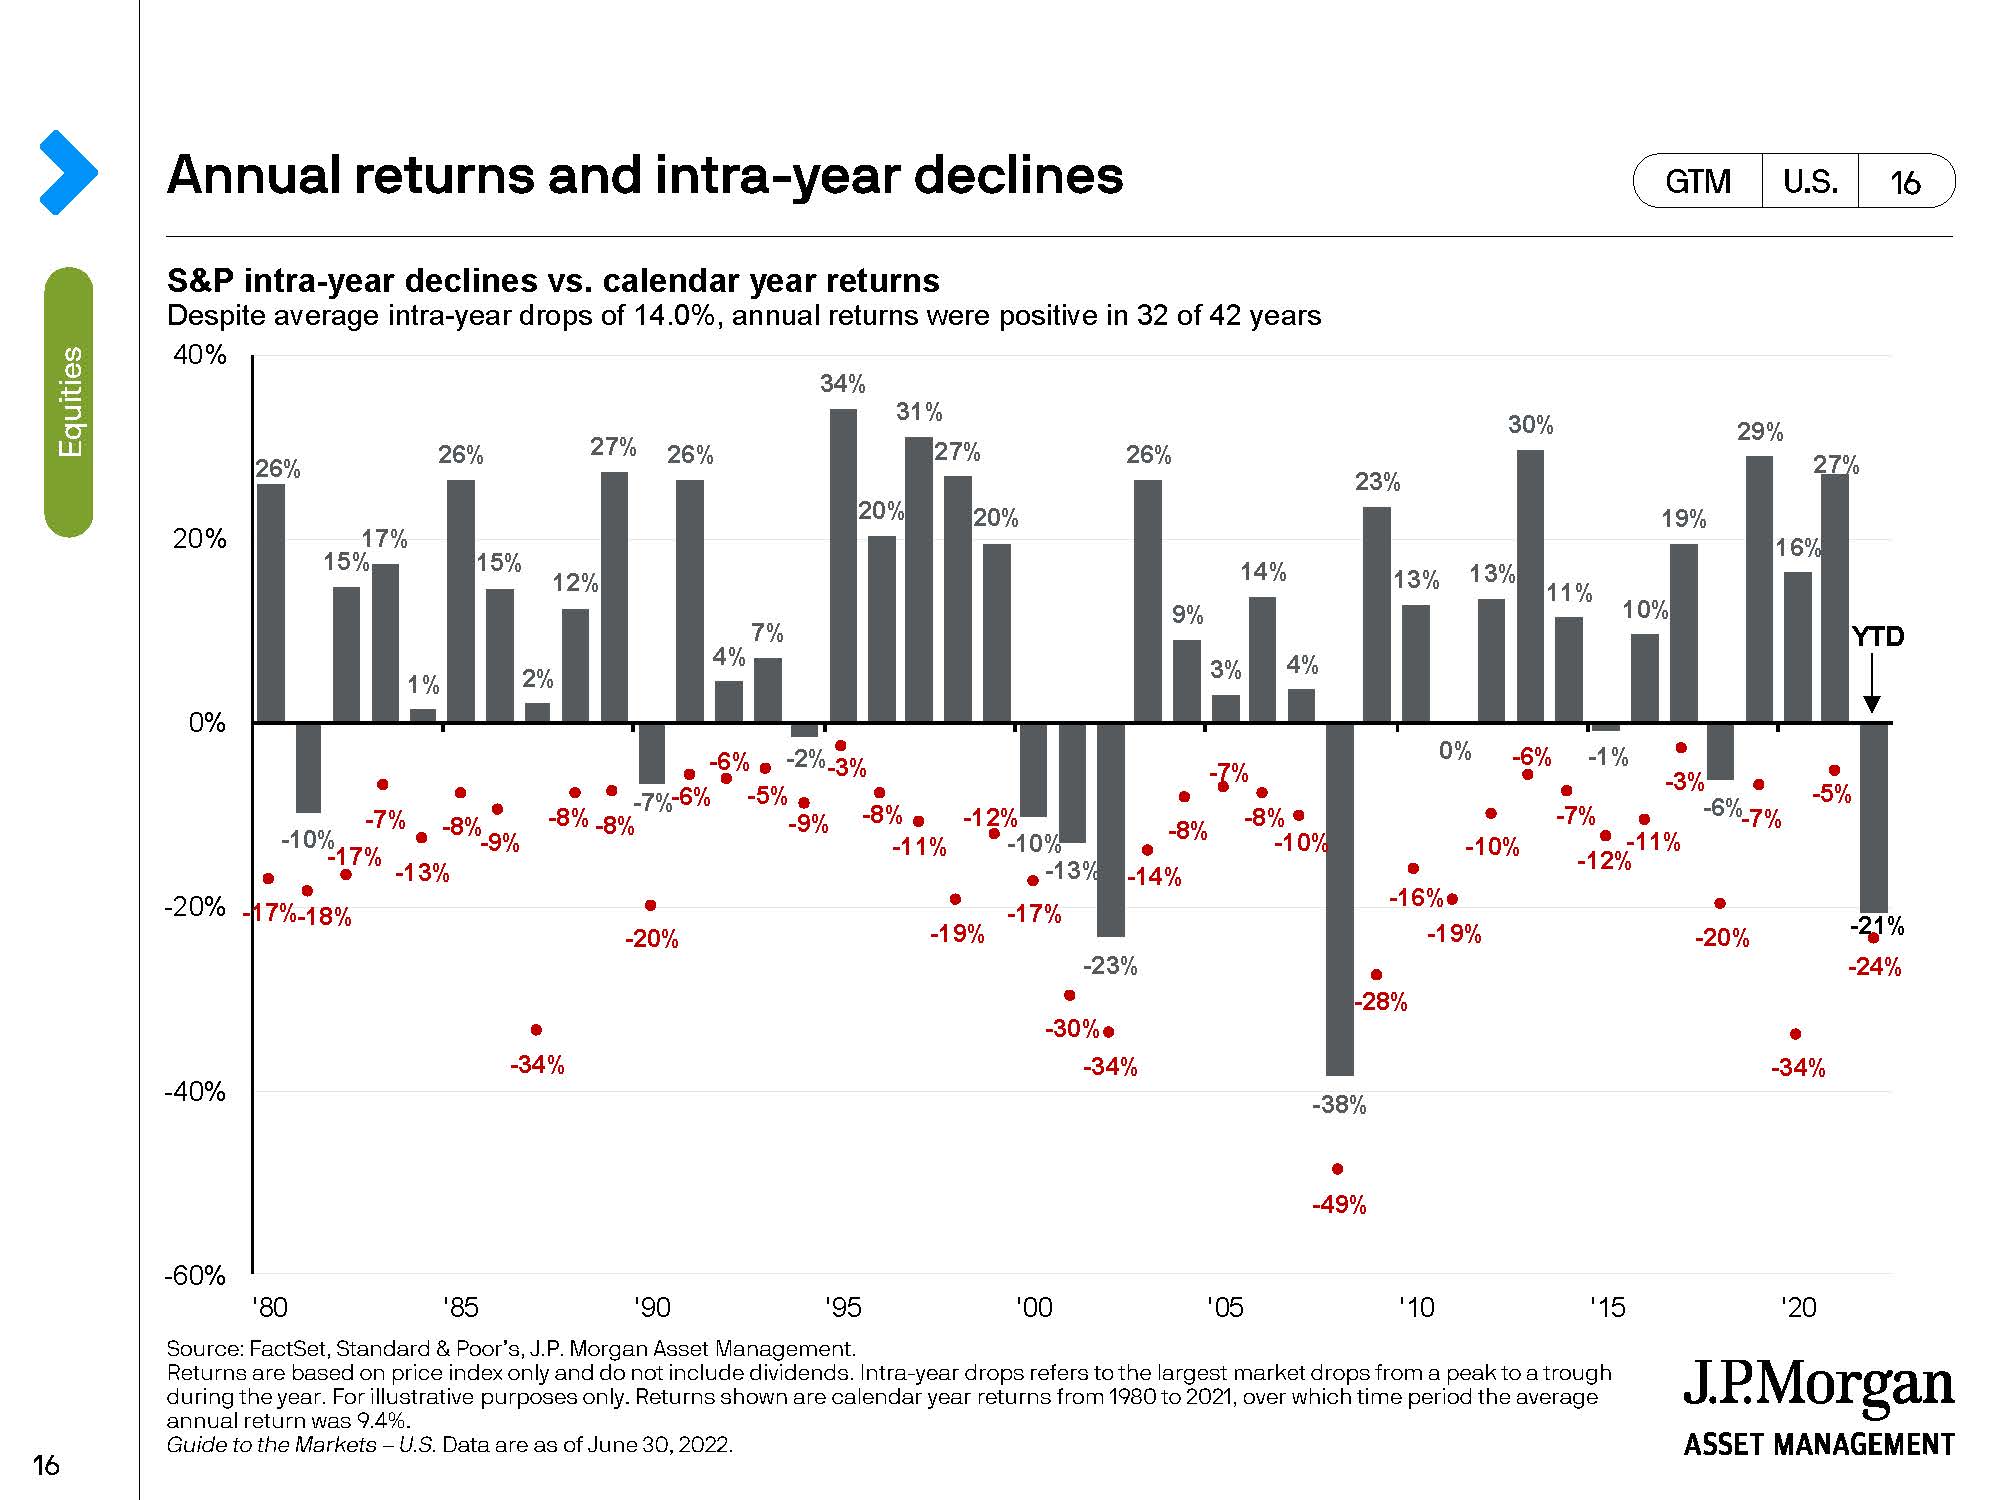
Stock market declines are no fun and when combined with bond market declines (which are supposed to hedge the stock market returns) it becomes even more uncomfortable for most investors. In the midst of all the “gloom and doom”, it becomes all too easy to lose sight of long-term strategy. In Chart 15 the reader will see many years when during the year, the S&P 500 was down, sometimes shockingly – only to finish the year in positive territory.
Chart 15
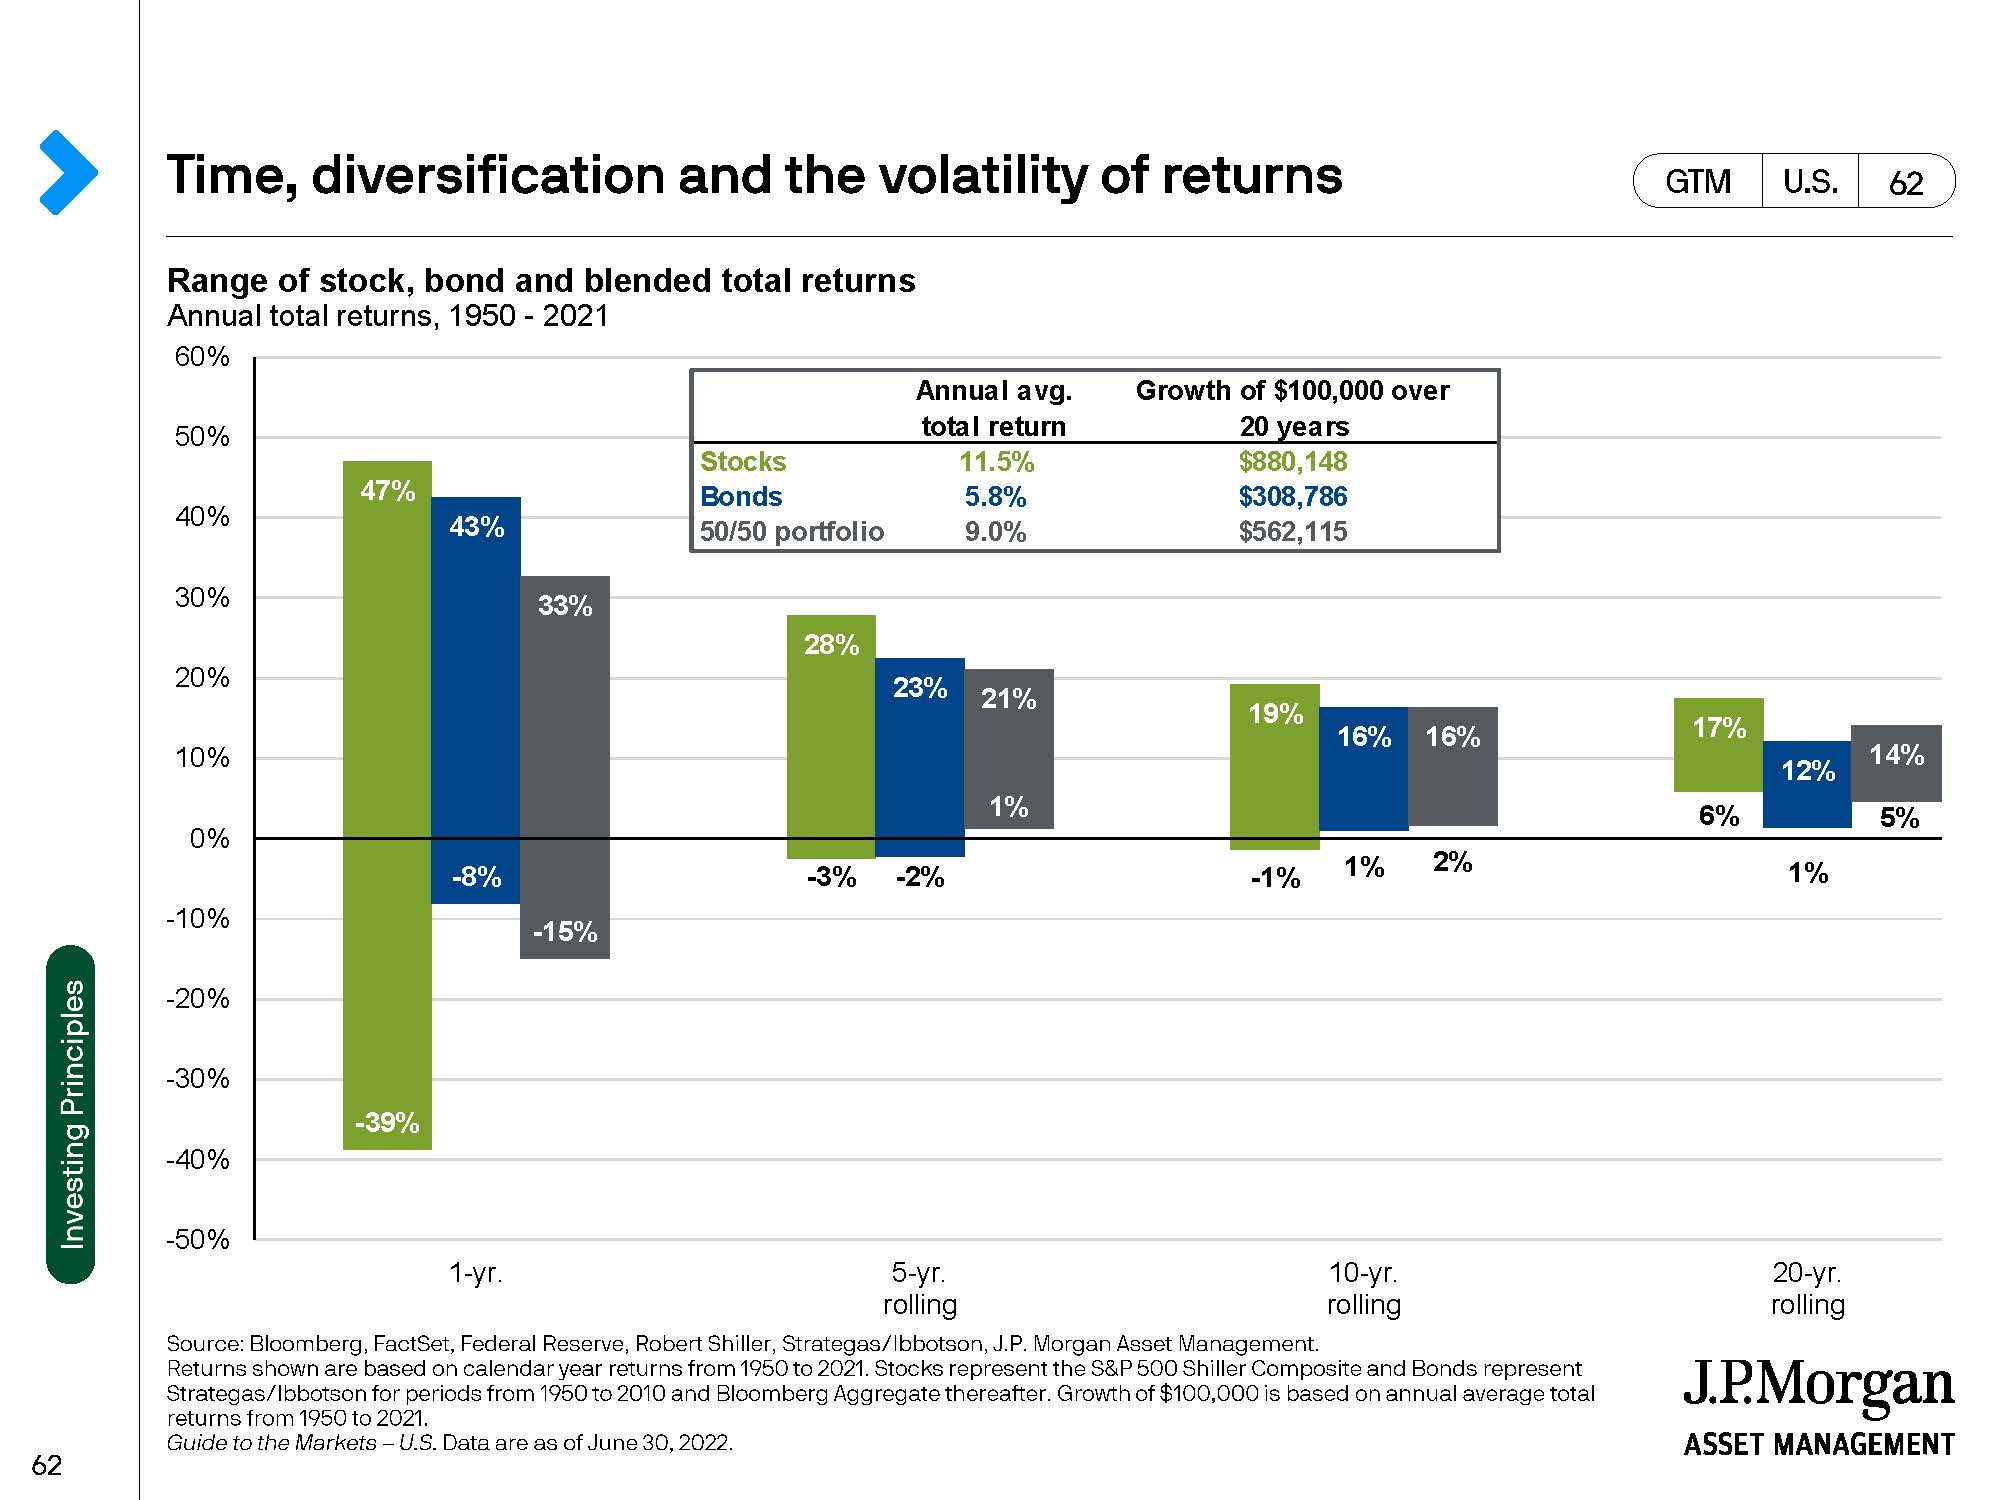
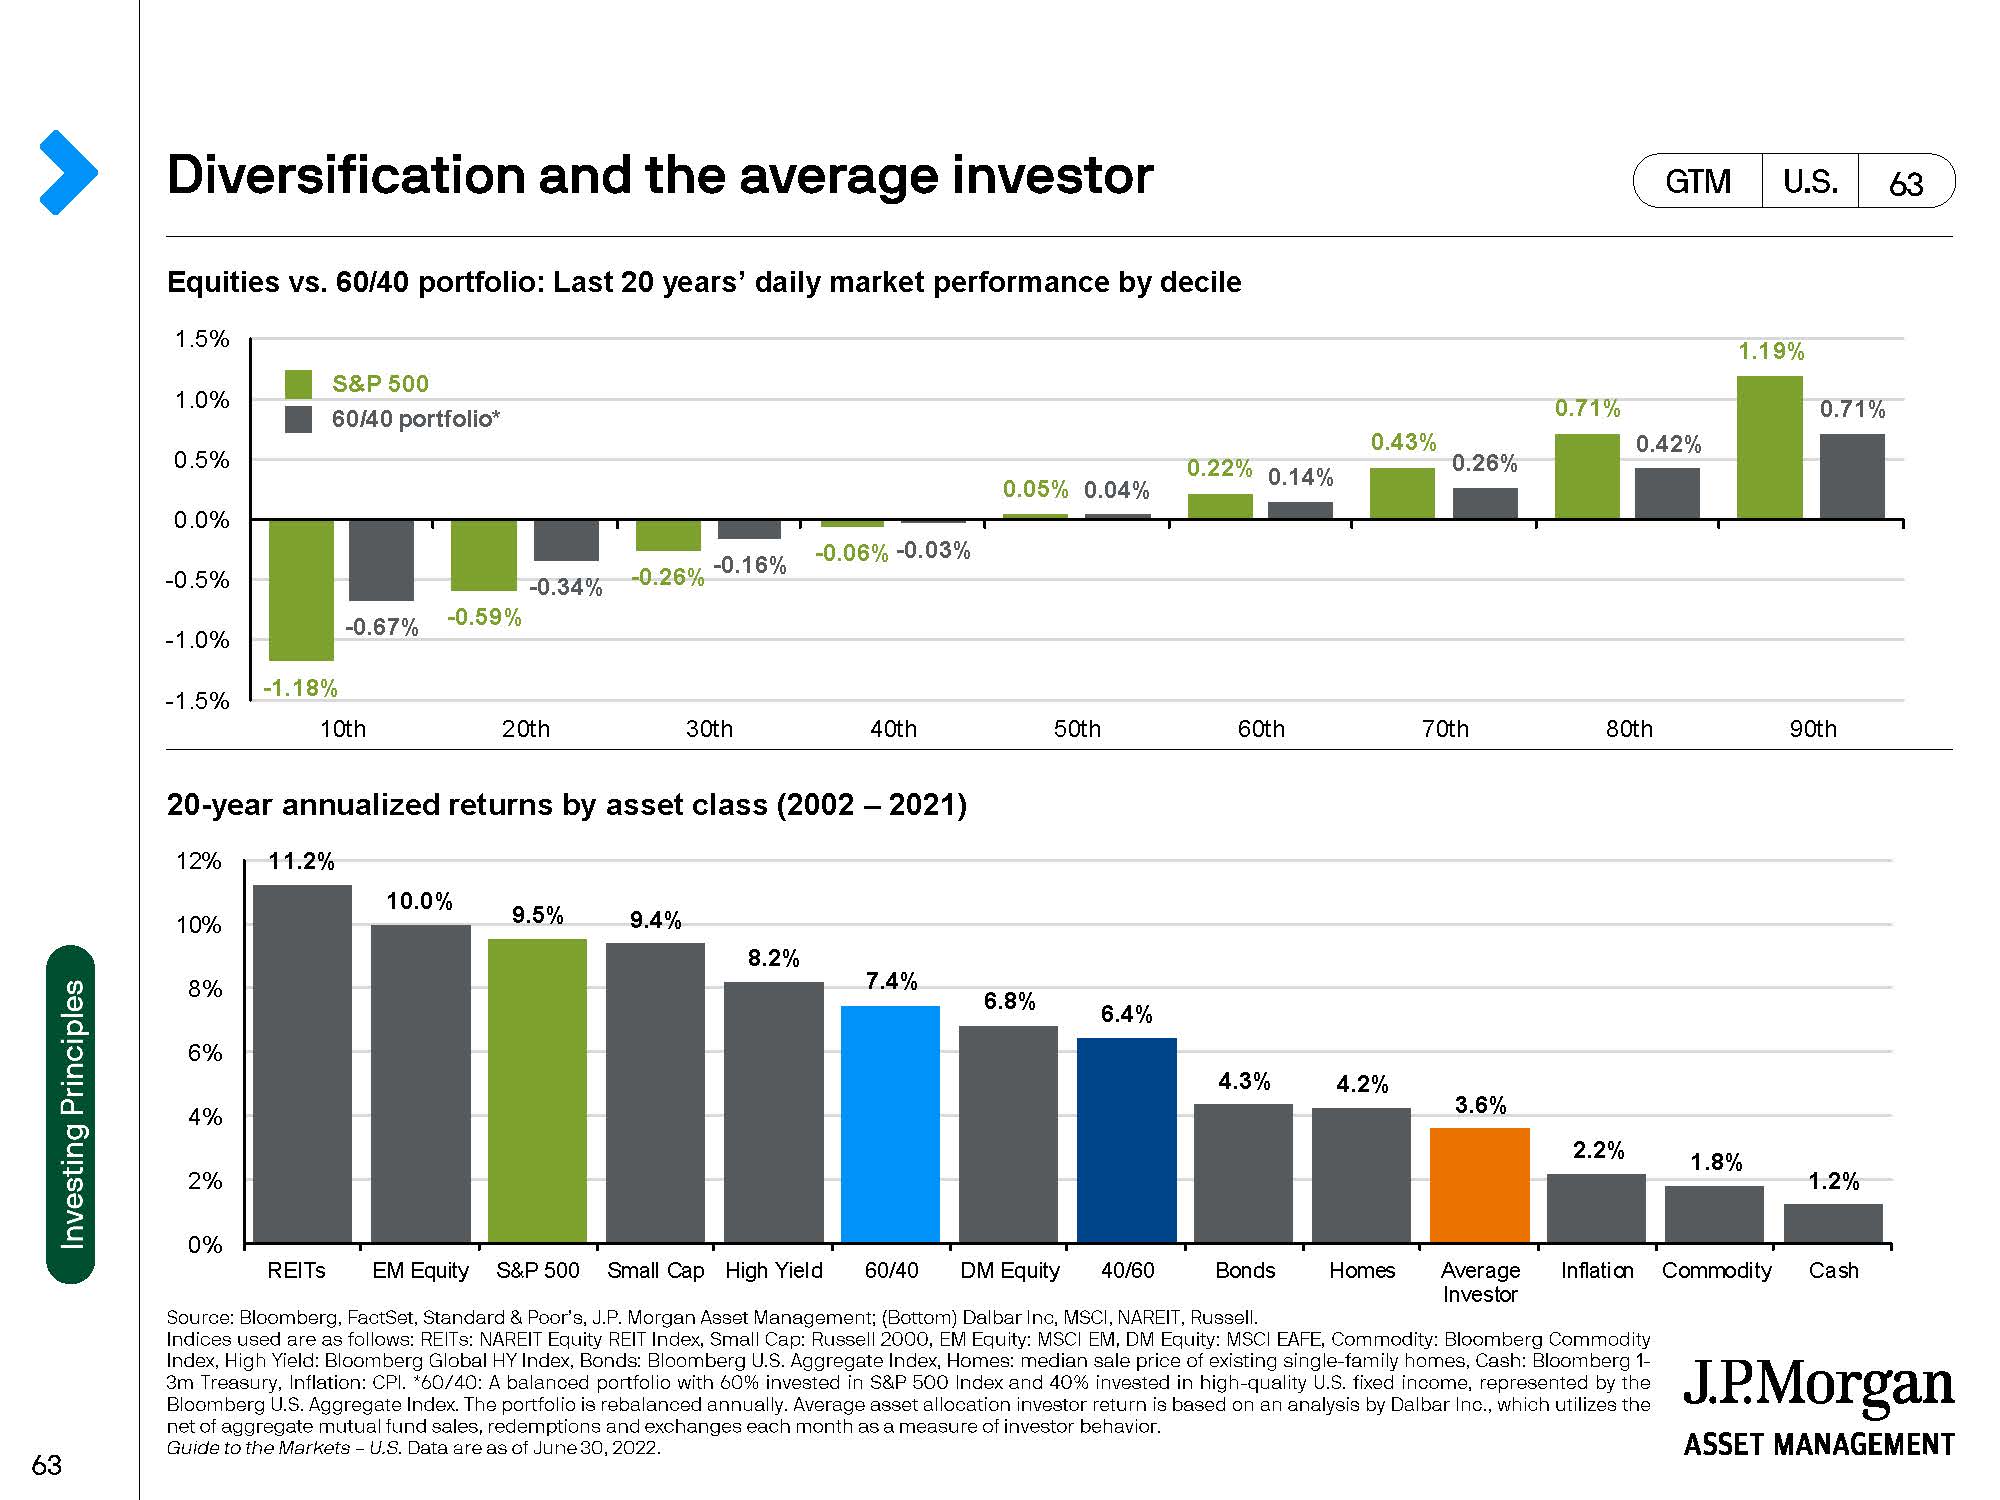
In Chart 16, we look at the volatility of returns for stocks, bonds and a 50/50 portfolio over various rolling time periods. While equities are the most volatile asset class, they delivered the highest rates of return over time by quite a wide margin and bonds did the least well.
Chart 16
But diversification has its strong merits as it allows an investor to recoup a “downdraft” more quickly.
Chart 17
Is cash “King”? That has not usually been the case. It is tempting to go “to cash” during a downturn. But that takes two difficult decisions:
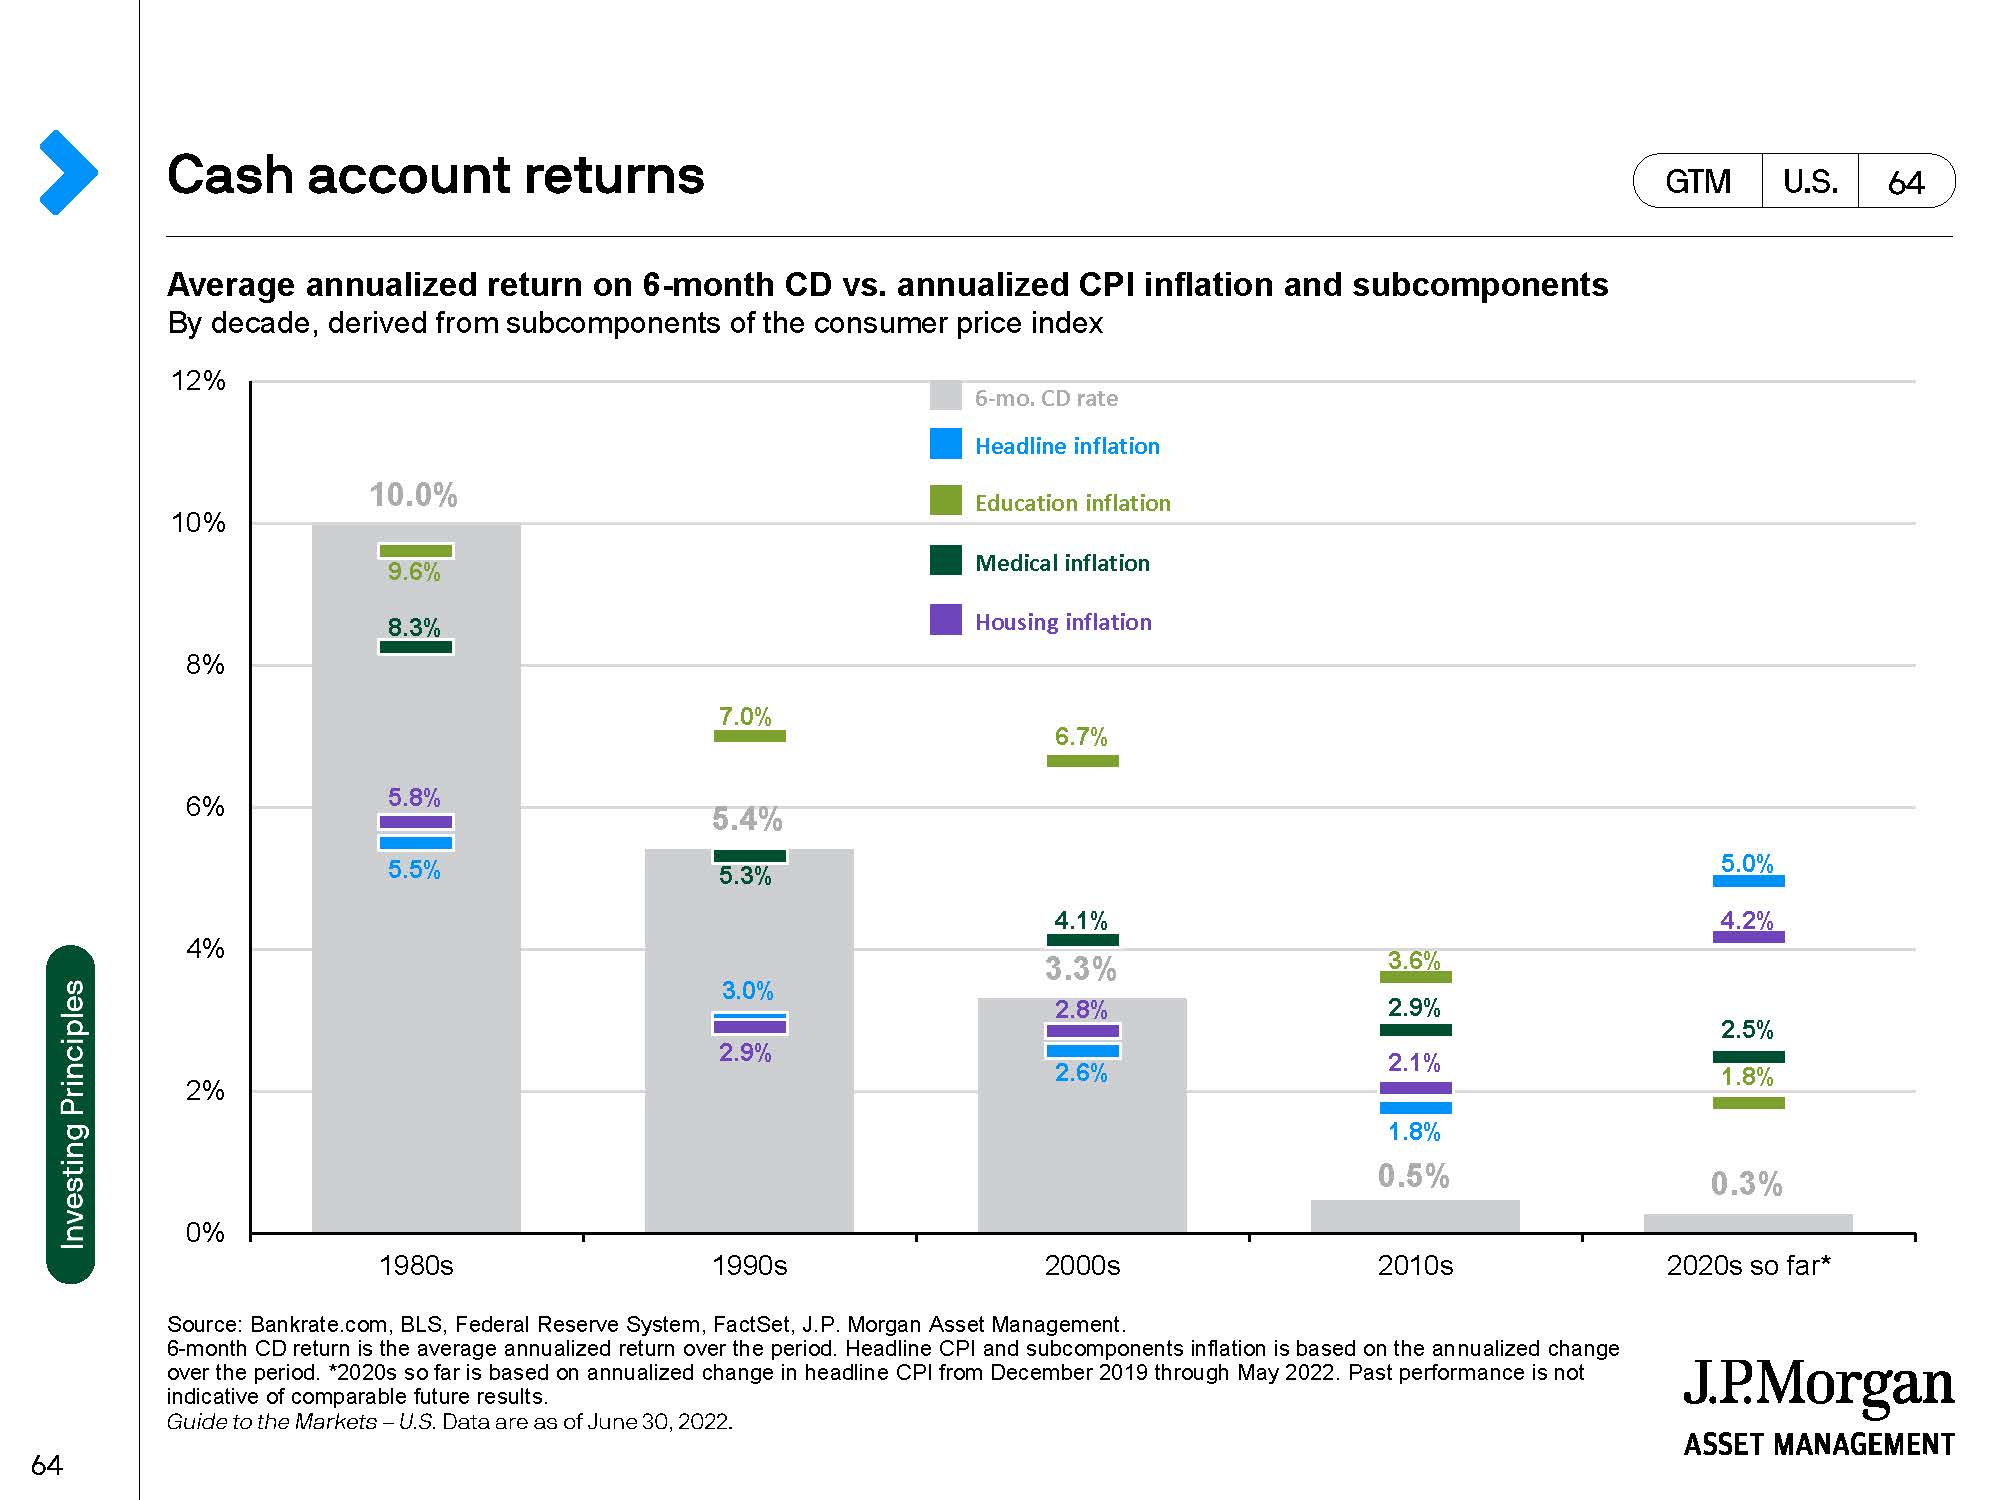
1) When do I sell? and 2) When do I get back in? The first decision is the easier of the two and it is usually emotions (fear) which drive it. The second decision is the far more difficult to make, because when one should buy, there will be “blood in the streets” to paraphrase Baron Rothschild. The second decision point will always come at the darkest hour and few are brave enough to execute. Missing a few key days of market action will destroy long term performance. This has been demonstrated many times. Further, Chart 18 below well demonstrates that returns on cash have not been and are not enough to beat inflation.
Chart 18
TO SUM…….
The American consumer is in financially good shape because of very high employment and a “rock solid” balance sheet. So too are US businesses in fine fettle having just come off a stellar year in 2021. Local and state governments are running budget surpluses. Only the Federal government is leveraged and dealing with huge deficits – but deficits which have come down dramatically in 2022. Despite the seeming good financial condition of consumers, they do not feel good about the direction of the US economy due to inflation which is way above the Fed’s target range. This is important. Inflation is a big worry. The Federal Reserve has decided to become more aggressive in hiking interest rates to control inflation and the fear is that it will go too far and tip the US economy into recession. Already there are scattered reports of layoffs and real estate price declines in a few markets. This “softening” should help dampen inflation. Because the consumer, corporations, and state and local governments are in such good financial shape, we think that the US economy should be quite resilient. In other words, even in the face of a recession, the result should not be too damaging to the American economy – i.e., a “shallow recession”. The stock market over the past almost 50 years has experienced 6 interest rate hiking periods and has performed well the majority of the time. While remembering that past performance does not guarantee future returns, we always like to “bet with the house” and the house’s past performance would suggest that long term investors will get through this rough period in the markets.
PREDICTIONS FOR 2022
- Interest rates to rise a bit in 2022. Yes – The Fed continues to raise rates.
- The dollar will be firm. Yes – Interest rate support & overseas troubles.
- Corporate earnings will be strong – but not grow as fast as in 2021. Yes – Still the case.
- U.S. infrastructure spending will take off. Yes – Should be happening soon.
- China will continue to threaten Taiwan, but not move on Taiwan. Yes – So far “saber rattling” but no shots fired.
- Russia, after lots of “saber rattling”, will back away from Ukraine. No – Remans the “headline” for 2022.
- Oil will stay well priced. Yes – Demand & the Ukrainian war have supported pricing.
- Inflation will “simmer down” from closing 2021 levels. No – Inflation still too high.
- Investor “risk appetites” will stay strong. No – Inflation & international troubles have “spooked” the stock & bond markets around the world.
- U.S. stocks will continue to make progress – but more subdued than in 2021. No – A “bear” market is at hand.
A FINAL THOUGHT
The opinions expressed in this Commentary are those of Baldwin Investment Management, LLC. These views are subject to change at any time based on market and other conditions, and no forecasts can be guaranteed. The reported numbers enclosed are derived from sources believed to be reliable. However, we cannot guarantee their accuracy. Past performance does not guarantee future results. We recommend that you compare our statement with the statement that you receive from your custodian. A list of our Proxy voting procedures is available upon request. A current copy of our ADV Part II & Privacy Policy is available upon request or at www.baldwinmgt.com/disclosures.