
Since the pandemic, business all over the world has moved supply lines heavily concentrated in China to other locales to enhance resilience. These shifts have been studied by the Boston Consulting Group (BCG) and their conclusions we find interesting, particularly regarding American manufacturers. In short, the work has started, great progress has been made – but the work is not finished.
According to BCG, the primary driver of the change in production locale has been the hunt for lower costs. China used to be the preferred destination for most any manufacturer because of its low-cost environment – but that changed with the imposition of tariffs.
CHART 1
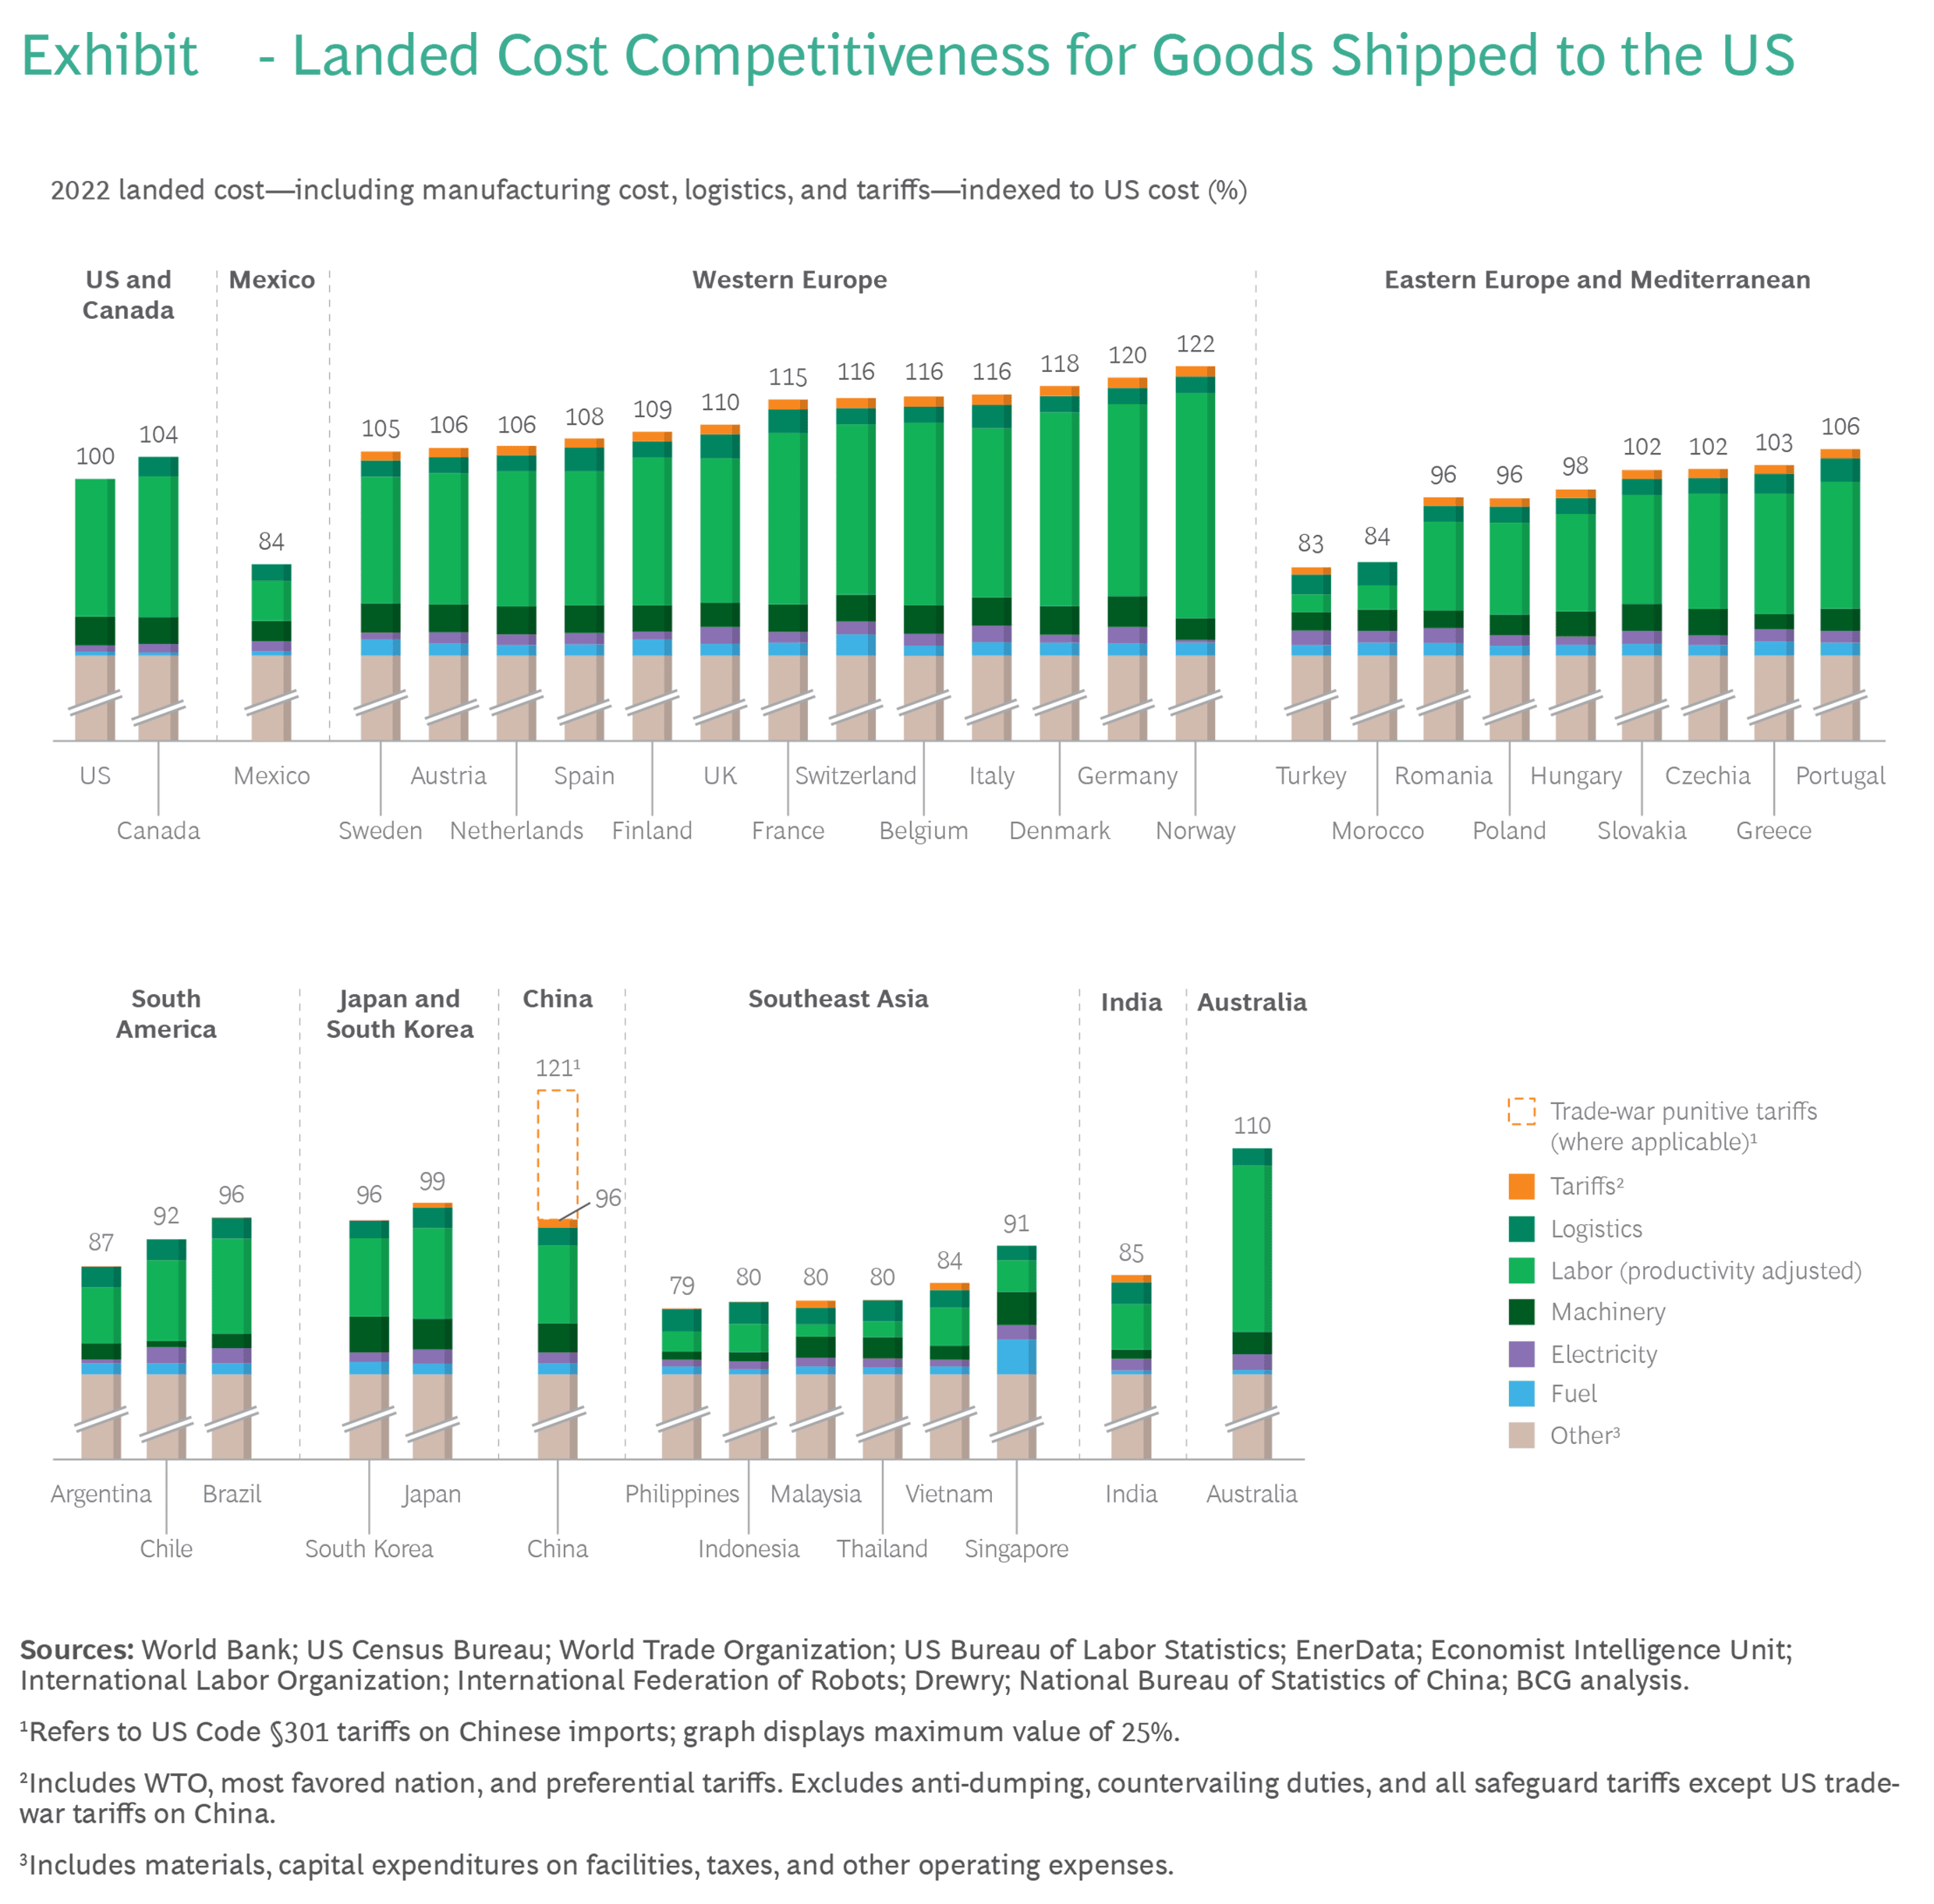
Further, geopolitical tensions have amplified the rationale to diversify the supply chain. Many companies have found reasonable alternatives to China, which have competitive cost structures, deep pools of labor and growing scale and capability across numerous industries.
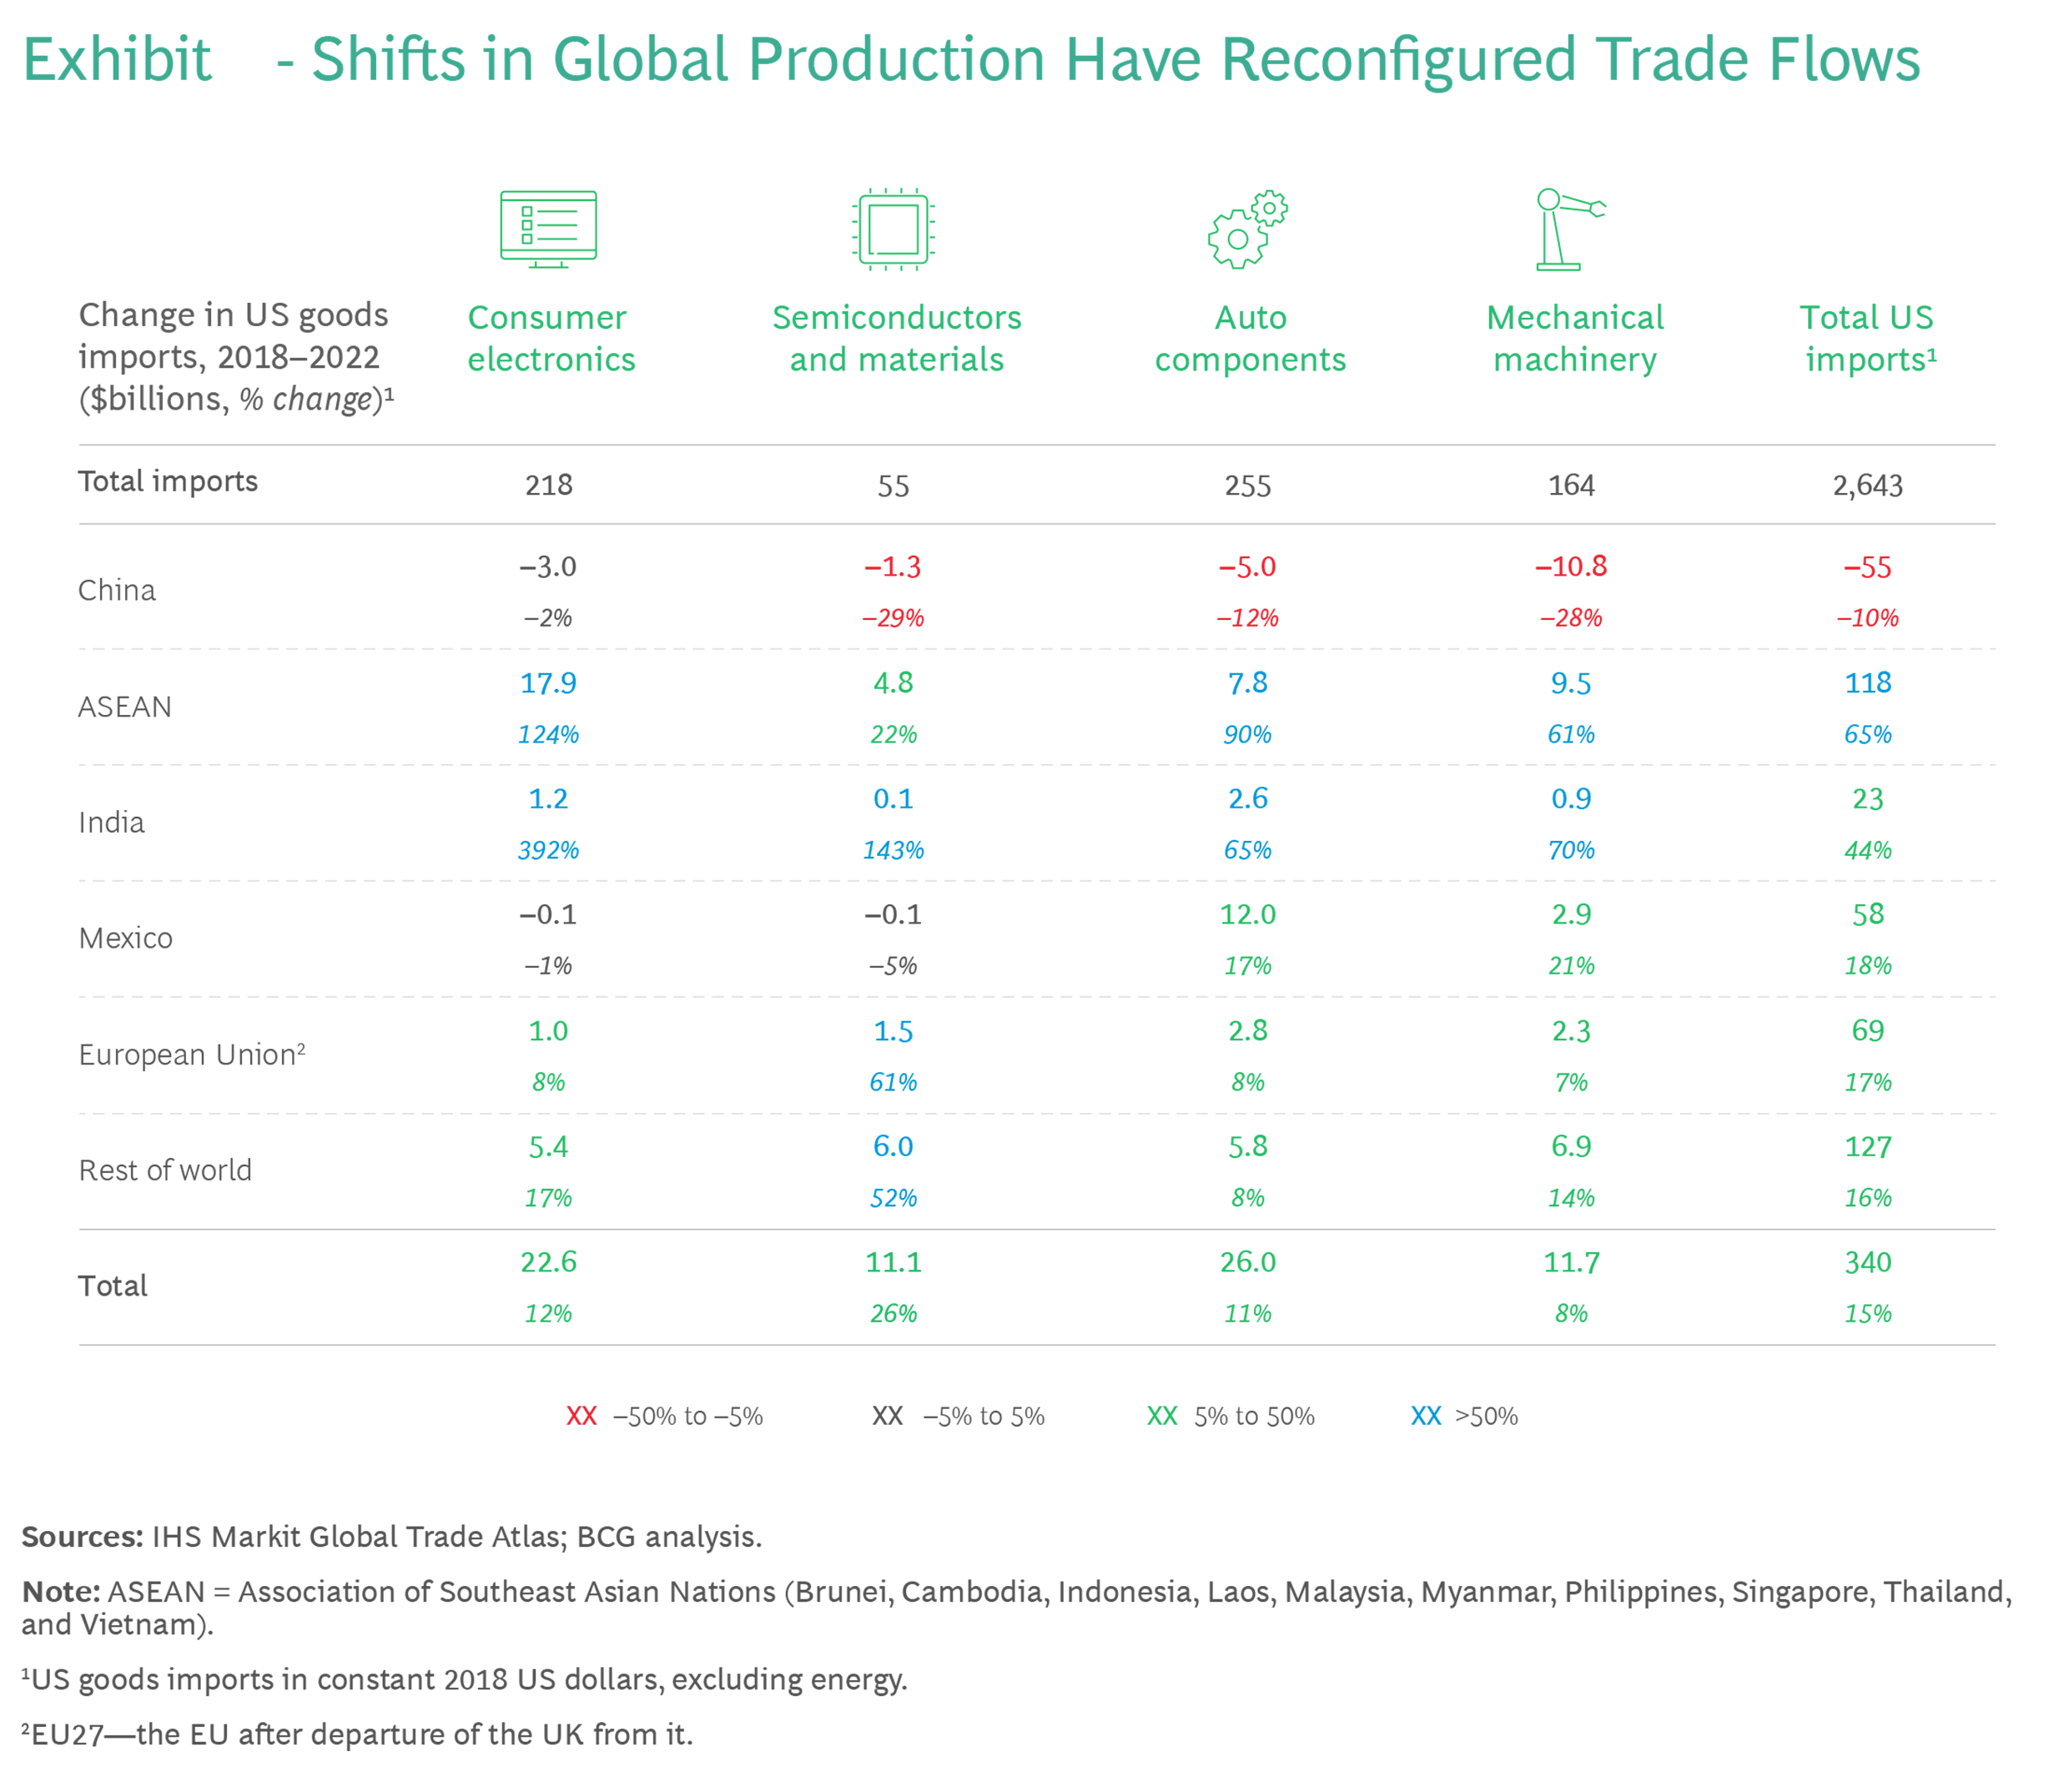
From 2018 – 2022, US imports from China declined by 10% in inflation adjusted terms – while they rose by 18%
from Mexico, 44% from India and 65% from the ten countries of the ASEAN (Southeast Asian Nations.)
CHART 2
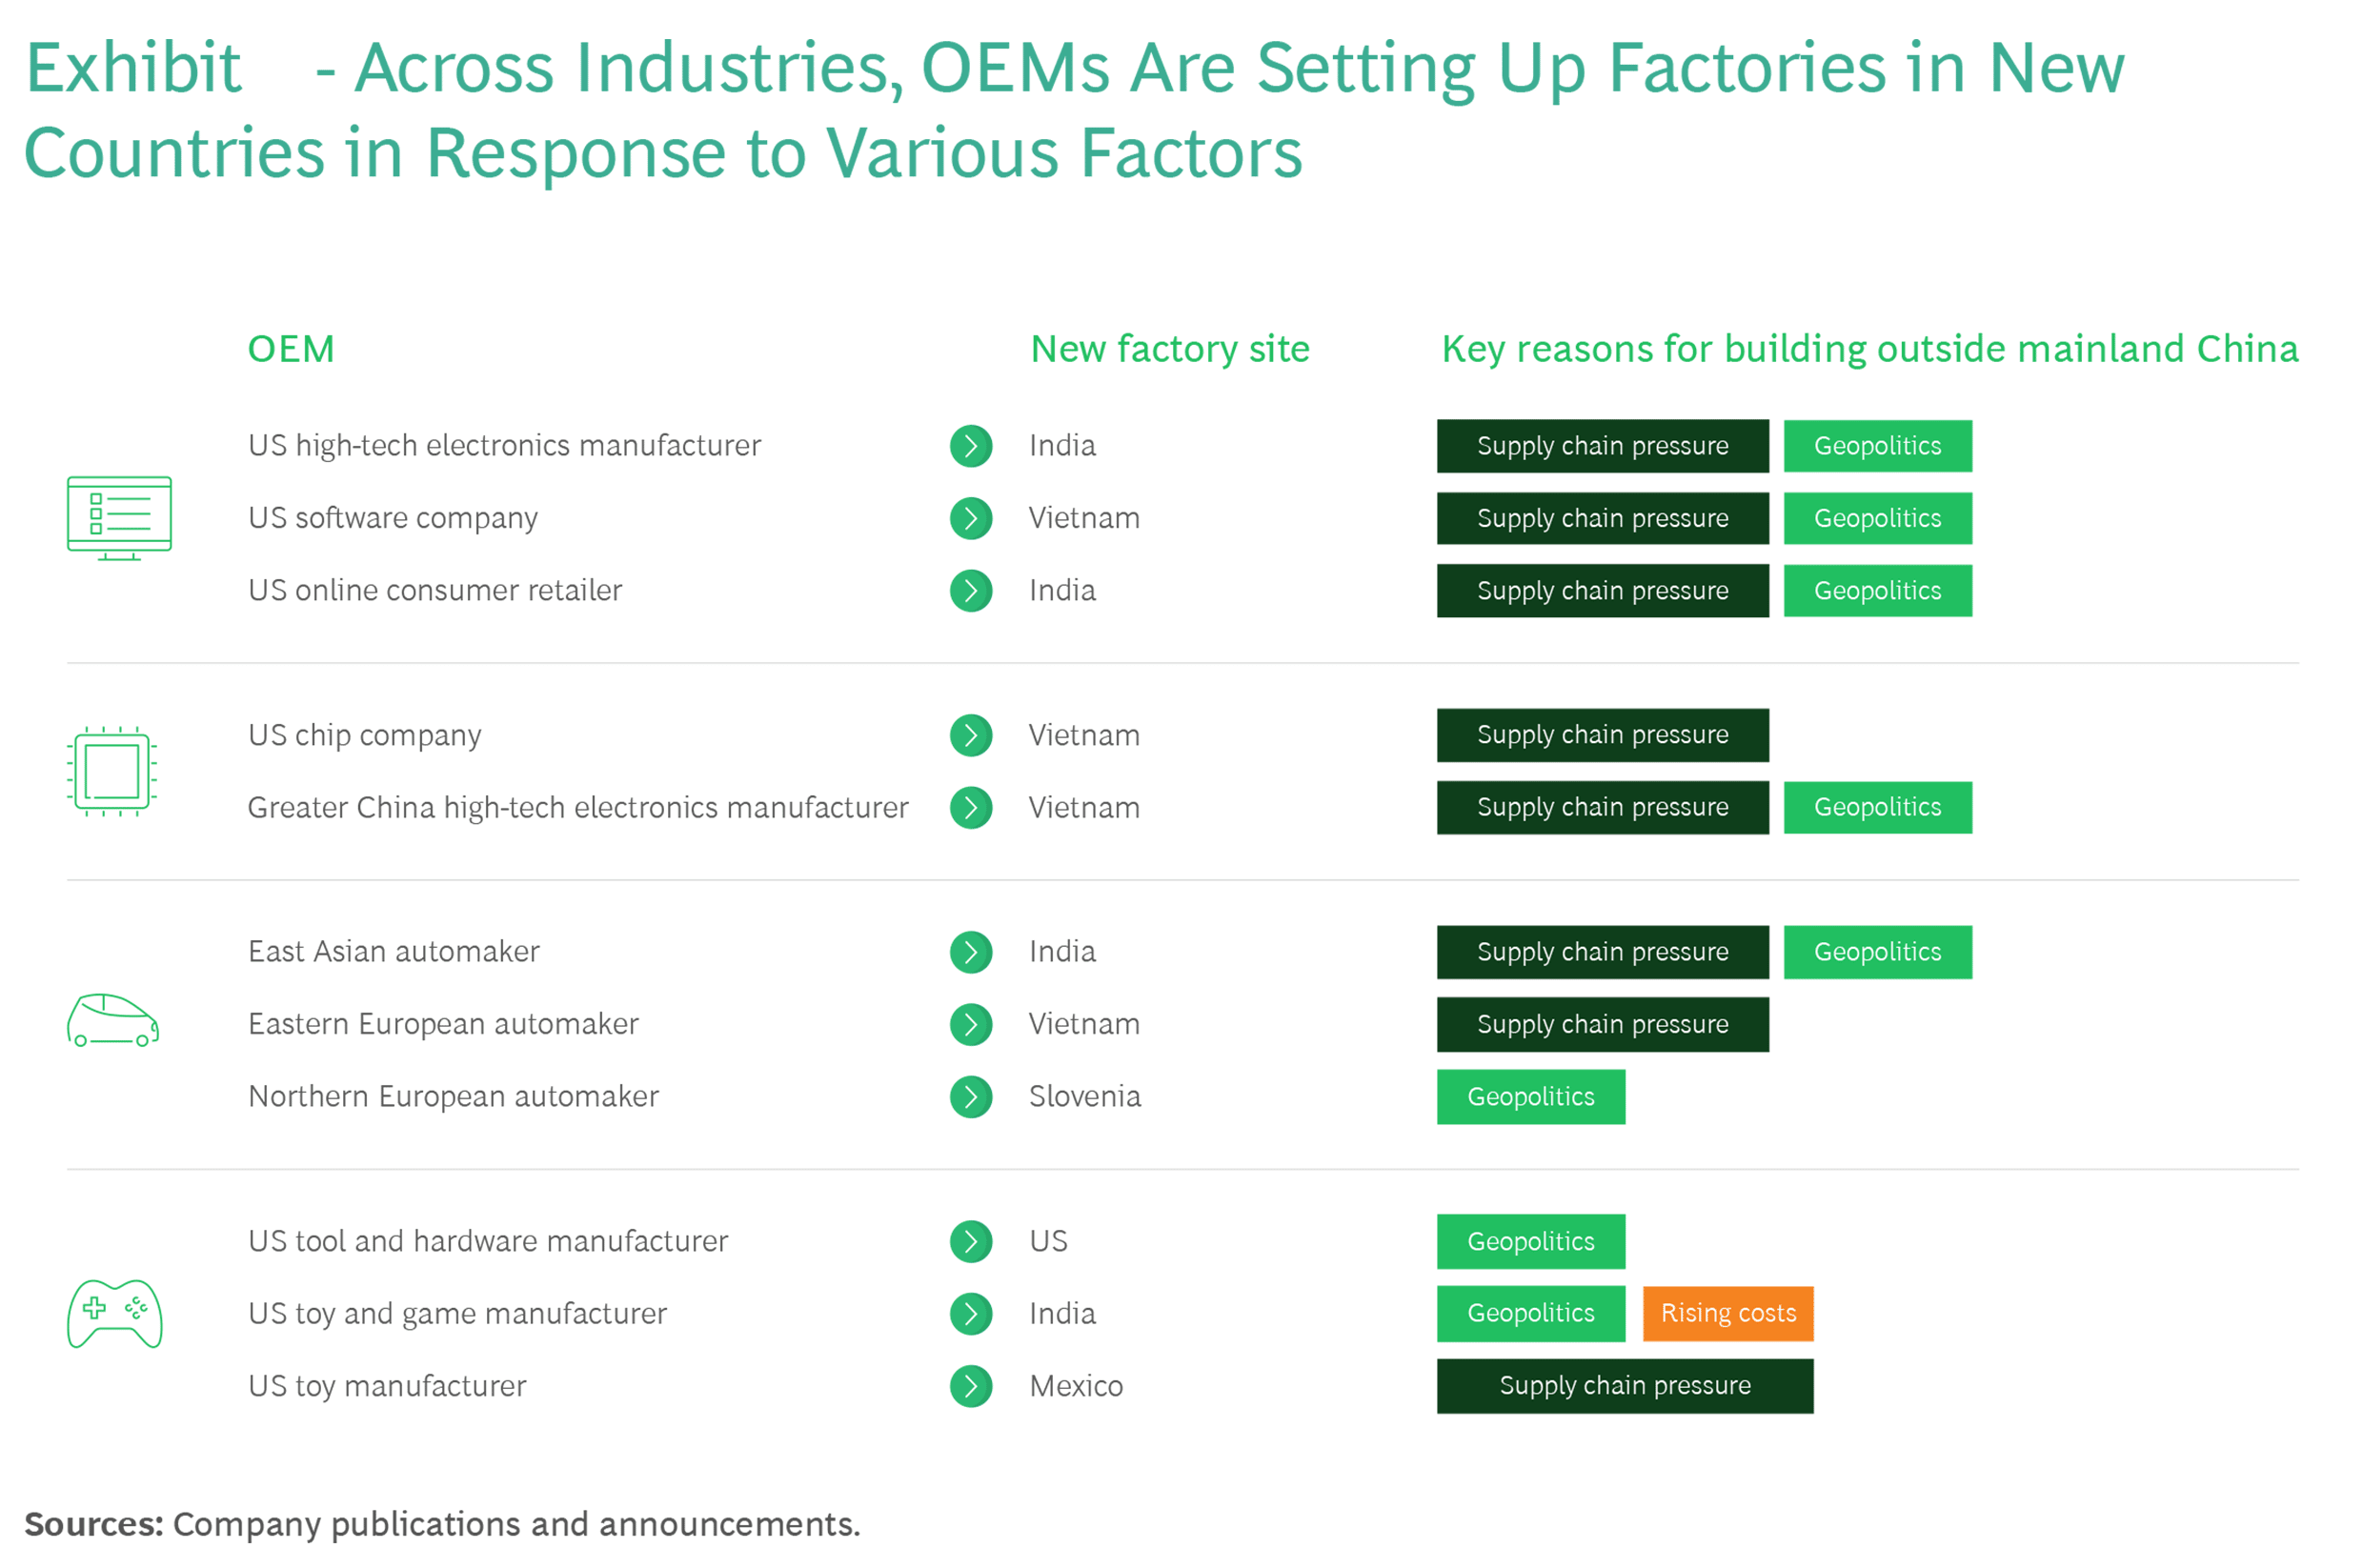
In Chart 3 below, the reader will note the type of manufacturer which has moved, to where it has moved and the reasons for the move:
CHART 3
No one country today has all the answers for a company to locate within its borders. But that is exactly the point. Because if a country did have all the answers, then there would be corporate concentration as there was in China – which was perceived for years as having all the answers to a company’s questions about desirable manufacturing location, until it didn’t due to geopolitical tensions. There will be tradeoffs between proximity to end markets, labor and raw material supplies, political position, etc. Each country has its own advantages and disadvantages.
CHART 4
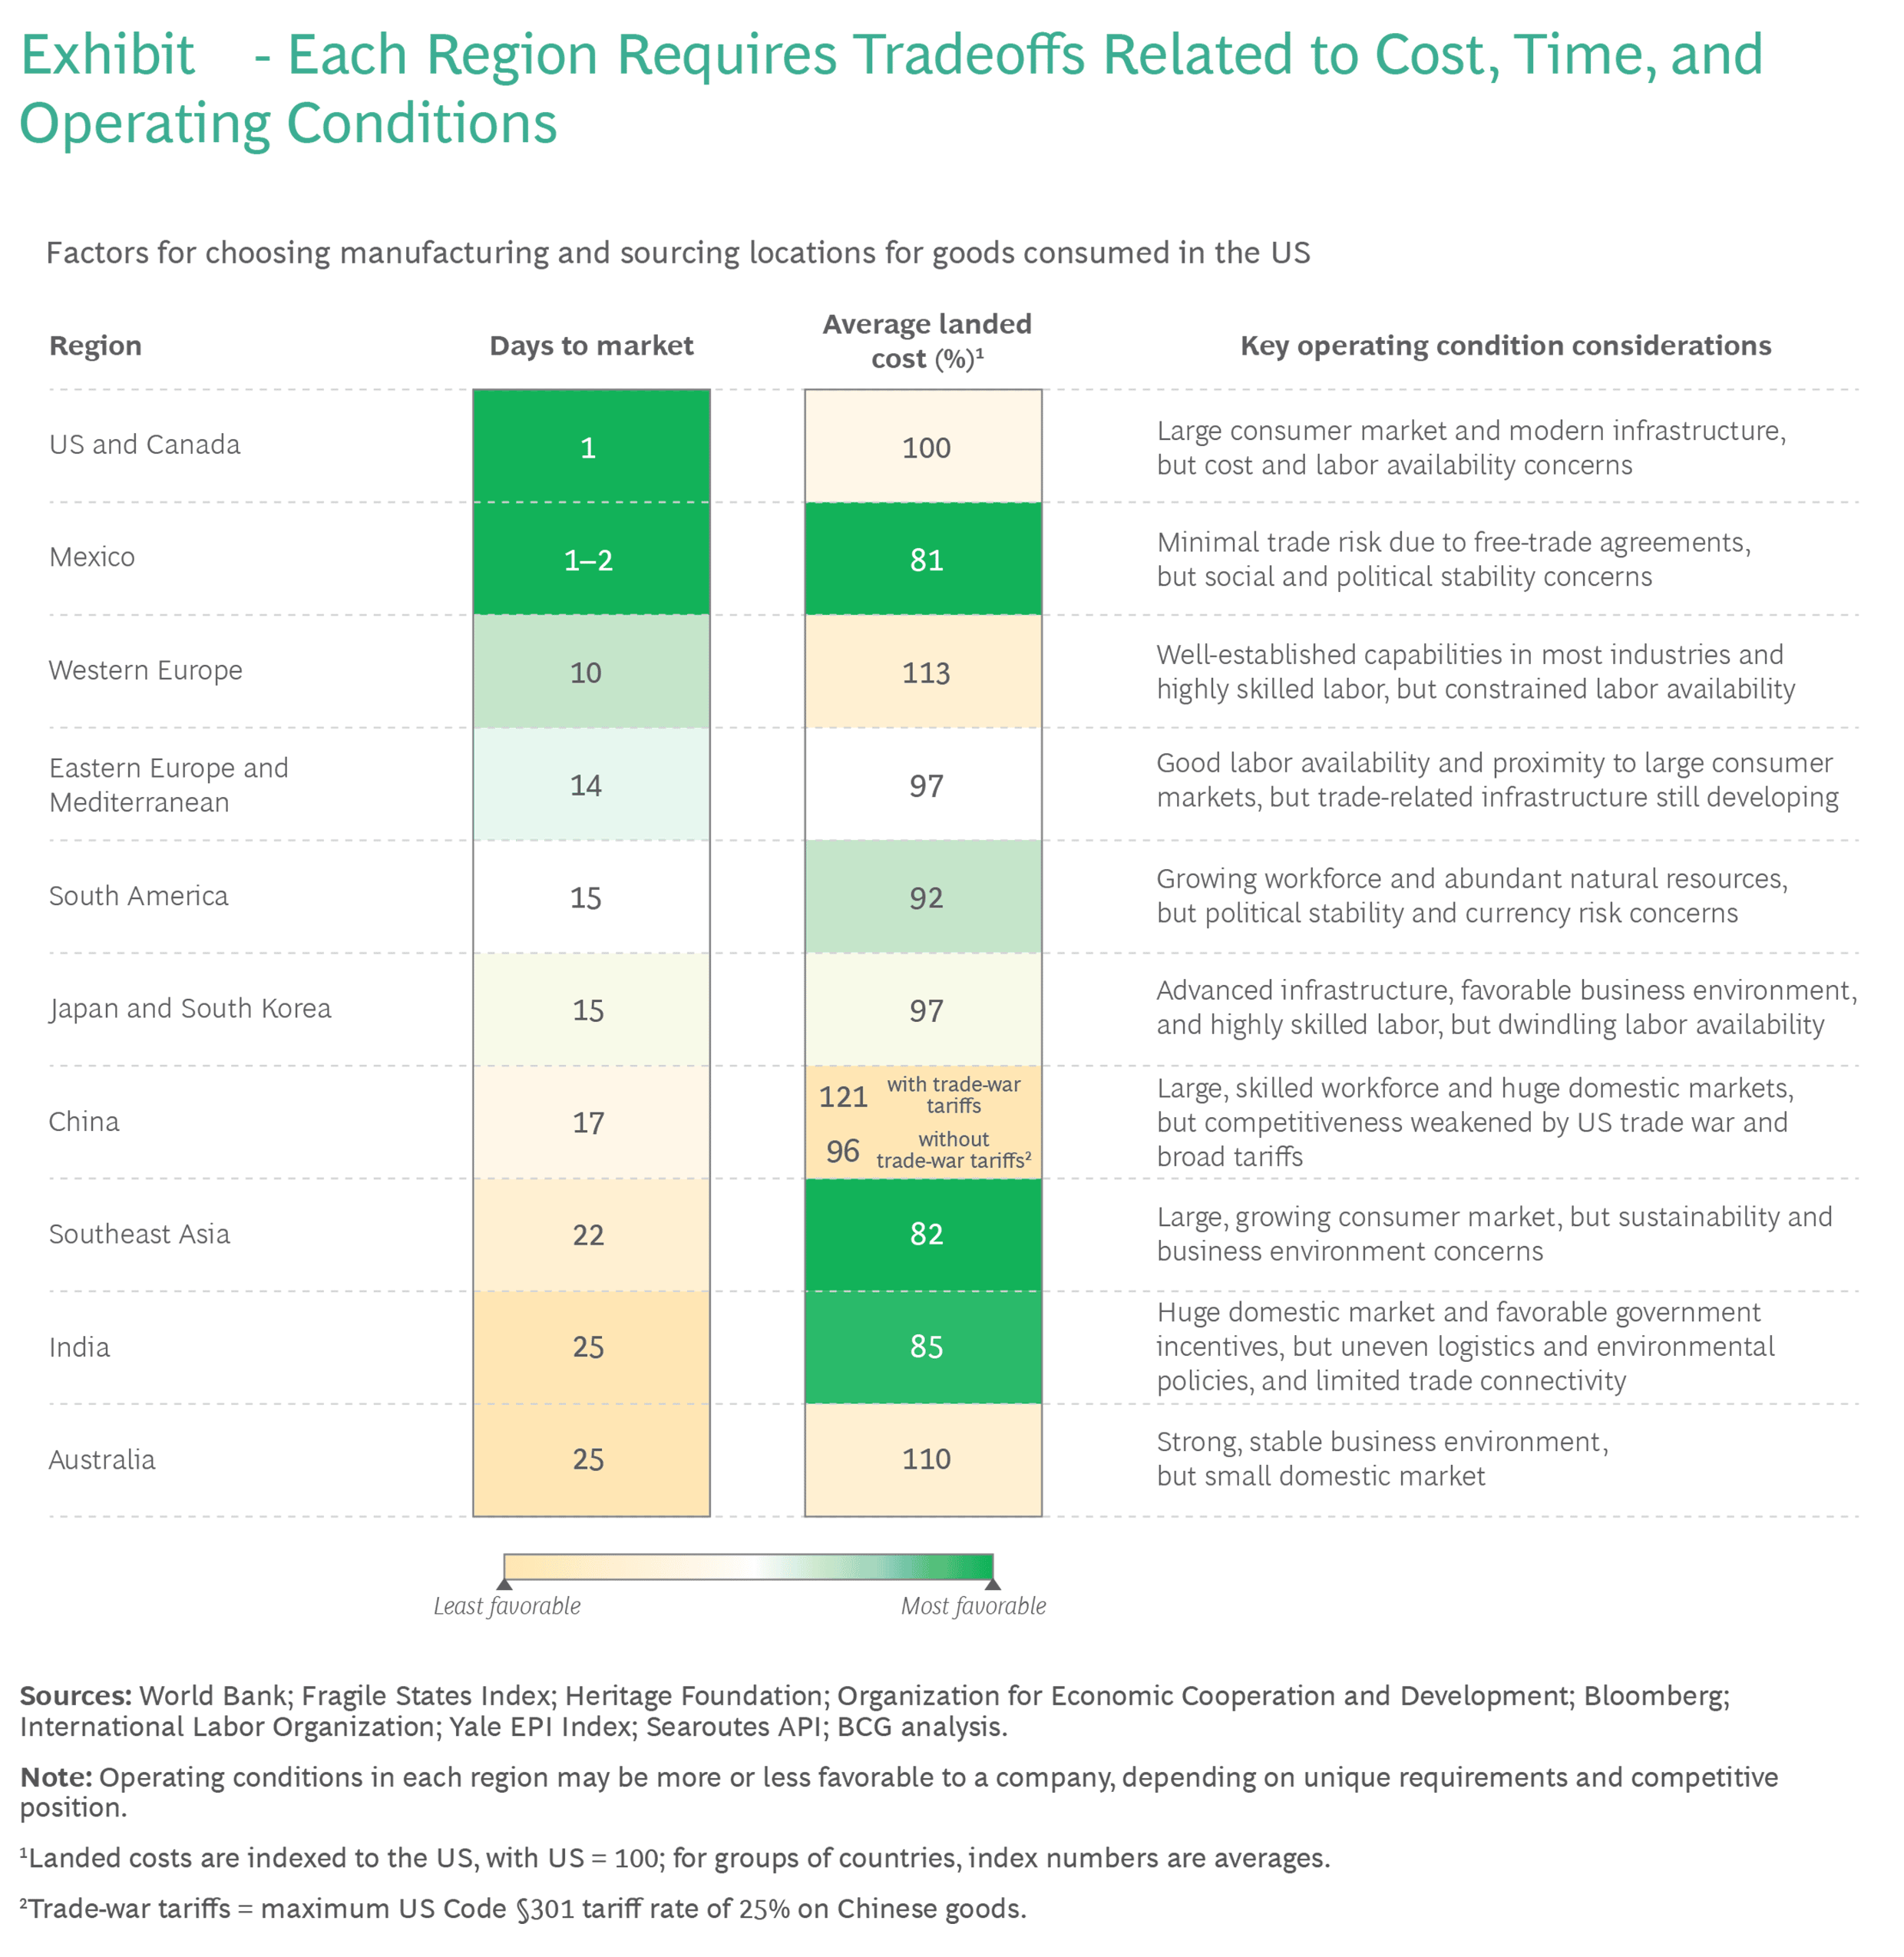
Western Europe, Canada and the US offer reduced political risk, shorter time to market and strong operating conditions for companies that want to “re-shore” their supply chains. But these are higher cost manufacturing sites and adequate labor availability is also a question mark. Mexico is a cost competitive “near – shoring” possibility for the US and Canadian markets, but operating conditions can be problematic. Nevertheless, Mexico has built up substantial industrial scale and capabilities because of NAFTA and its successor treaty. Morocco and Turkey are considered favorites for manufacturing near Europe with competitive costs, ample labor and proximity to the Eurozone. China is still a manufacturing powerhouse – but its future has been damaged because of geopolitical concerns which have escalated costs. The ASEAN countries are taking market share from China. India is considered the most probable to be the next China, as it has the most characteristics of China some 40 years ago, along with a democratic political system.
“Derisking” supply chains to make them resilient is a strategic focus of international manufacturers. Gone are the days when it was a simple decision to move production or to source production from only China. This concentration of productive capabilities increased company risk which became apparent during the pandemic. Supply logistics concentrated in China, which was disrupted by Covid and politics, led to a logistics nightmare, dramatically increasing costs and contributing to American inflation. Corporations have already started to move industrial capacity. They have had success improving resilience, sustainability and have cut supply chain costs by 20% – 50%, according to BCG. More industrial supply line movement will be made in the coming years, and this should mean good things for companies headquartered in the US and Europe, as buyers of lower cost goods – but also for corporations headquartered in places like India, Vietnam and Mexico, as the makers of those goods.
STILL GROWING ABOUT 2%, MORE OR LESS…
No boom, no bust – that accurately describes the American economy right now. Chart 5 below demonstrates this, using the financial markets as leading indicators. The US economic engine is running about as it has for a long time – with no recession in sight (yet):
CHART 5
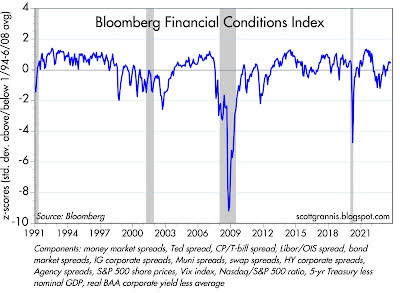
The Fed just met and held interest rates steady. This was the consensus opinion of pundits going into the meeting. There is still some thought of raising rates by 25 Bps later this year. But the real news was that expected interest rate decreases in 2024 might be pushed out to later in the upcoming year and there might be fewer of them. Why? Because the US economy continues to surprise analysts with its strength. We were told by numerous experts that America would suffer a recession in 2022 and then it was delayed to 2023; now some say it will be in 2024. We have never supported that position, yet have been watchful. But the sustained strength of the American economy continues to worry analysts about inflation. Because as night follows day, inflation will follow a strong economy – so the experts say. Resilience has been the characteristic of our American economy. Despite a pandemic, a war in Europe and several major bank failures in the US – the American economy has continued to “chug along” while inflation has come down dramatically and employment has remained strong. Currently, the UAW is striking the Big Three automakers, and this could have ripple effects throughout the manufacturing world affecting not just the car companies, but also their suppliers. Further, the US government may shut down over political impasses. Both events will not help American economic growth in the near term – probably shaving a couple of tenths of percent of growth off what is currently expected for 2023 – depending on how long the disruptions last. So if growth slows enough to worry the Fed, then interest rates may not rise as expected and may fall sooner– a scenario that is not consensus.
A FINAL OBSERVATION…
Courtesy of some work at Bank of America and Bloomberg, the following chart outlines the history of yields connected to the 10-year Treasury bond, considered by many to be the benchmark for federal financings.
CHART 6
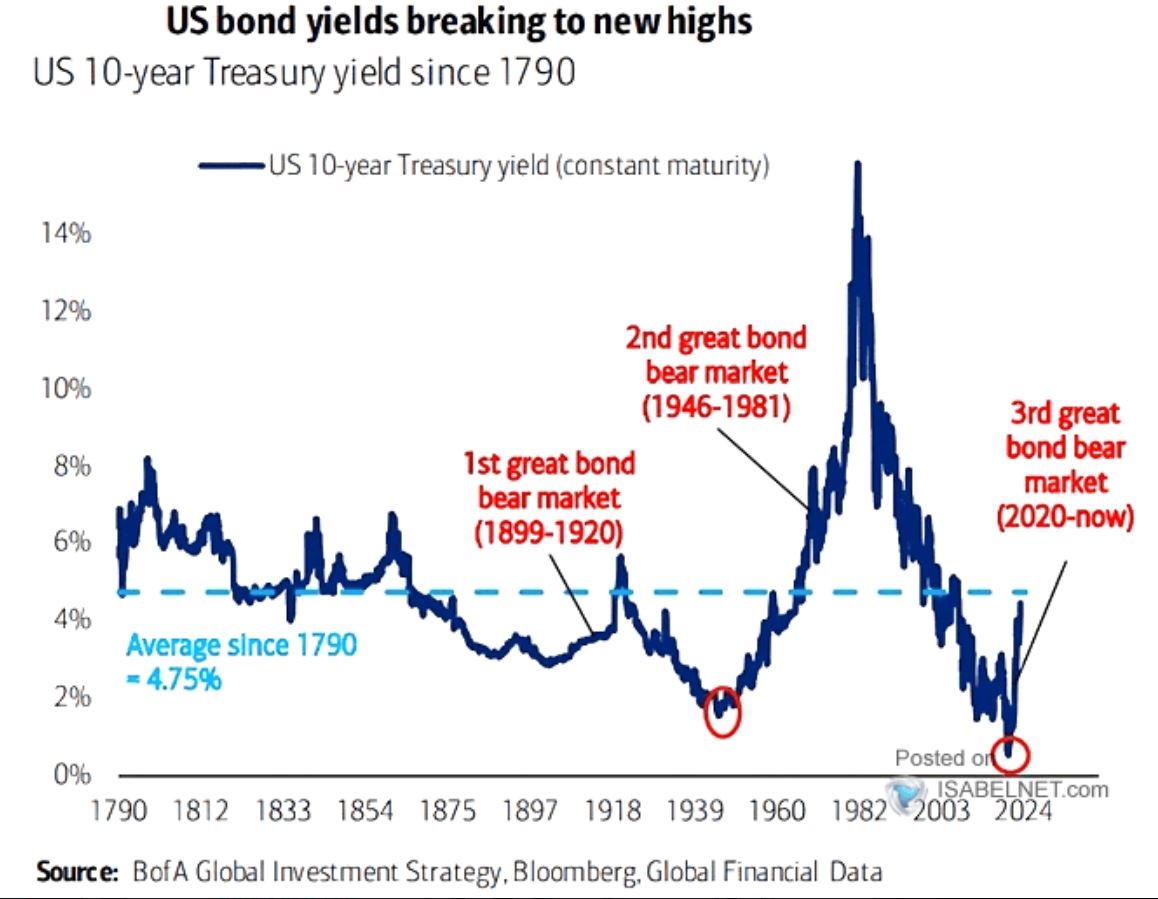
Looking back to 1790, the reader will note that the average yield on the US Treasury 10-year note has been 4.75% and that we are approaching that rate today, being slightly under it presently. Early in our country’s history, as a new country just emerging from a revolution, America paid a higher rate on its borrowings – no doubt to compensate investors for risk. By approximately 1870, America achieved a 4.75% interest rate on its benchmark paper and for the next 153 years we have mostly paid interest at a rate less than 4.75%. There was a time in the 1980’s when interest rates skyrocketed during an inflationary period and that was an extremely painful time to be a borrower. But our observation is that the US for most of its modern history (i.e., since 1870, post-Civil War) has been recognized by investors as a developing/developed country, not a frontier nation. Consequently, the interest rates paid for capital in the markets have typically been at 4.75% or less (except for that time in the 1980’s), during times of World Wars, bank failures, recessions and even pandemics. Rates at levels less than 4.75% on 10-year paper are typical, not exceptional, for the US. We would argue to those who think interest rates need to go higher – that would be unusual and not reflective of most of American history.
A FINAL THOUGHT…

Geopolitical Rational For Supply Line Diversification…

A Pause to Reflect…
The opinions expressed in this Commentary are those of Baldwin Investment Management, LLC. These views are subject to change at any time based on market and other conditions, and no forecasts can be guaranteed.
The reported numbers enclosed are derived from sources believed to be reliable. However, we cannot guarantee their accuracy. Past performance does not guarantee future results.
We recommend that you compare our statement with the statement that you receive from your custodian.
A list of our Proxy voting procedures is available upon request. A current copy of our ADV Part II & Privacy Policy is available upon request or at www.baldwinmgt.com/disclosures.