
Are we at the top of US stock markets? Have we missed it if we have money to invest? Should we wait for a correction, or should we take the plunge? These are familiar questions that most investors ask after a strong rally in markets. Along with the questions come comparisons to similar times in the past and the ones most cited are the “Dotcom” bubble of 1999 – 2000 and the age of the “Nifty Fifty” back in 1972.
Before we start our contrast and compare, let’s first look at where we are. US stocks, as represented by the market weighted S&P 500, are trading at about 21X expected earnings – not exactly cheap. But a large part of the past year’s outperformance in the S&P 500 was due to the spectacular price performance of seven stocks, which have been dubbed the “Magnificent Seven” (Apple, Meta, Nvidia, Alphabet, Amazon, Microsoft, and Tesla). The rest of the S&P 500 (i.e., 493 stocks) have lagged the aforementioned winners by about 50%. So when simply looking at the “market” as represented by the S&P 500, one can be confused about performance – with a headline advance of 26% (which includes the “Magnificent Seven”, trading at a forward Price/Earnings ratio (P/E) of about 28X) and less skewed gain of about 13% (which excludes the “Seven” but includes the remaining 493, trading at forward P/E of about 18X).
Fundamental support for equity prices has come from two sources: a stronger than expected economy and the prospect of lower interest rates. The US economy surprised many forecasters in 2023 by not sinking into a recession. At the start of 2023, an imminent recession for the US economy was the central theme. This would in turn increase unemployment and allow the Fed to reduce interest rates, which would spur the economy out of its doldrums and back into growth. That was the expected economic scenario for 2023. But it did not happen that way. The US economy continued to grow (+2.5%) and companies continued to surprise Street analysts with better-than-expected results on the top and bottom lines. Going into earnings season for the fourth quarter, Wall Street was expecting corporate earnings to increase just over 1% for the quarter. In fact, company earnings grew 9% – i.e., 9 times analysts’ expectations. Now even greater expectations from many boardrooms have shaped 2024 earnings projections. In 2024, the US economy is forecasted to be ahead by +2.1% (GDP). There are infrastructure programs incorporated in the Inflation Reduction Act and the CHIPS Act which are still in their early stages of execution which will provide plenty of fiscal stimulus to the domestic economy. From this fundamental setting of a strong economy, corporate earnings are expected to grow a healthy 11% in 2024.
Also helping drive stock price increases have been the progressively clear signals from the Federal Reserve that interest rate hikes were done, that markets could look forward to interest rate stability and then cuts. In fact, we have had no reductions in rates yet. The Fed has not adjusted rates since the middle of last year, and since then, there has been little more than Fed jawboning and hawkish rhetoric to keep stock and bond markets in check to some extent. But with the Fed seemingly on the cusp of its first interest rate cut – thus starting a new period of cheaper money – the stock and bond markets have preemptively moved in anticipation of this important monetary catalyst.
So, a stronger than forecasted economy with better-than-expected corporate results and the anticipation of cheaper money have fueled US markets. But is all that good already reflected in equity prices or is there more to be had?
In 2000, around the time of the Dotcom Bust after the internet rally, the US Federal Reserve was easing monetary policy in response to the Asian currency crisis of 1997 – 1998. In Europe, monetary authorities were cutting interest rates, preparing for the introduction of the Euro. The forward P/E ratio at the peak of the S&P 500 in March 2000 was 25.2X with a dividend yield of 1.4%. The 10-year Treasury was trading with a yield of 6.2%. Please see Chart 1 below:
CHART1
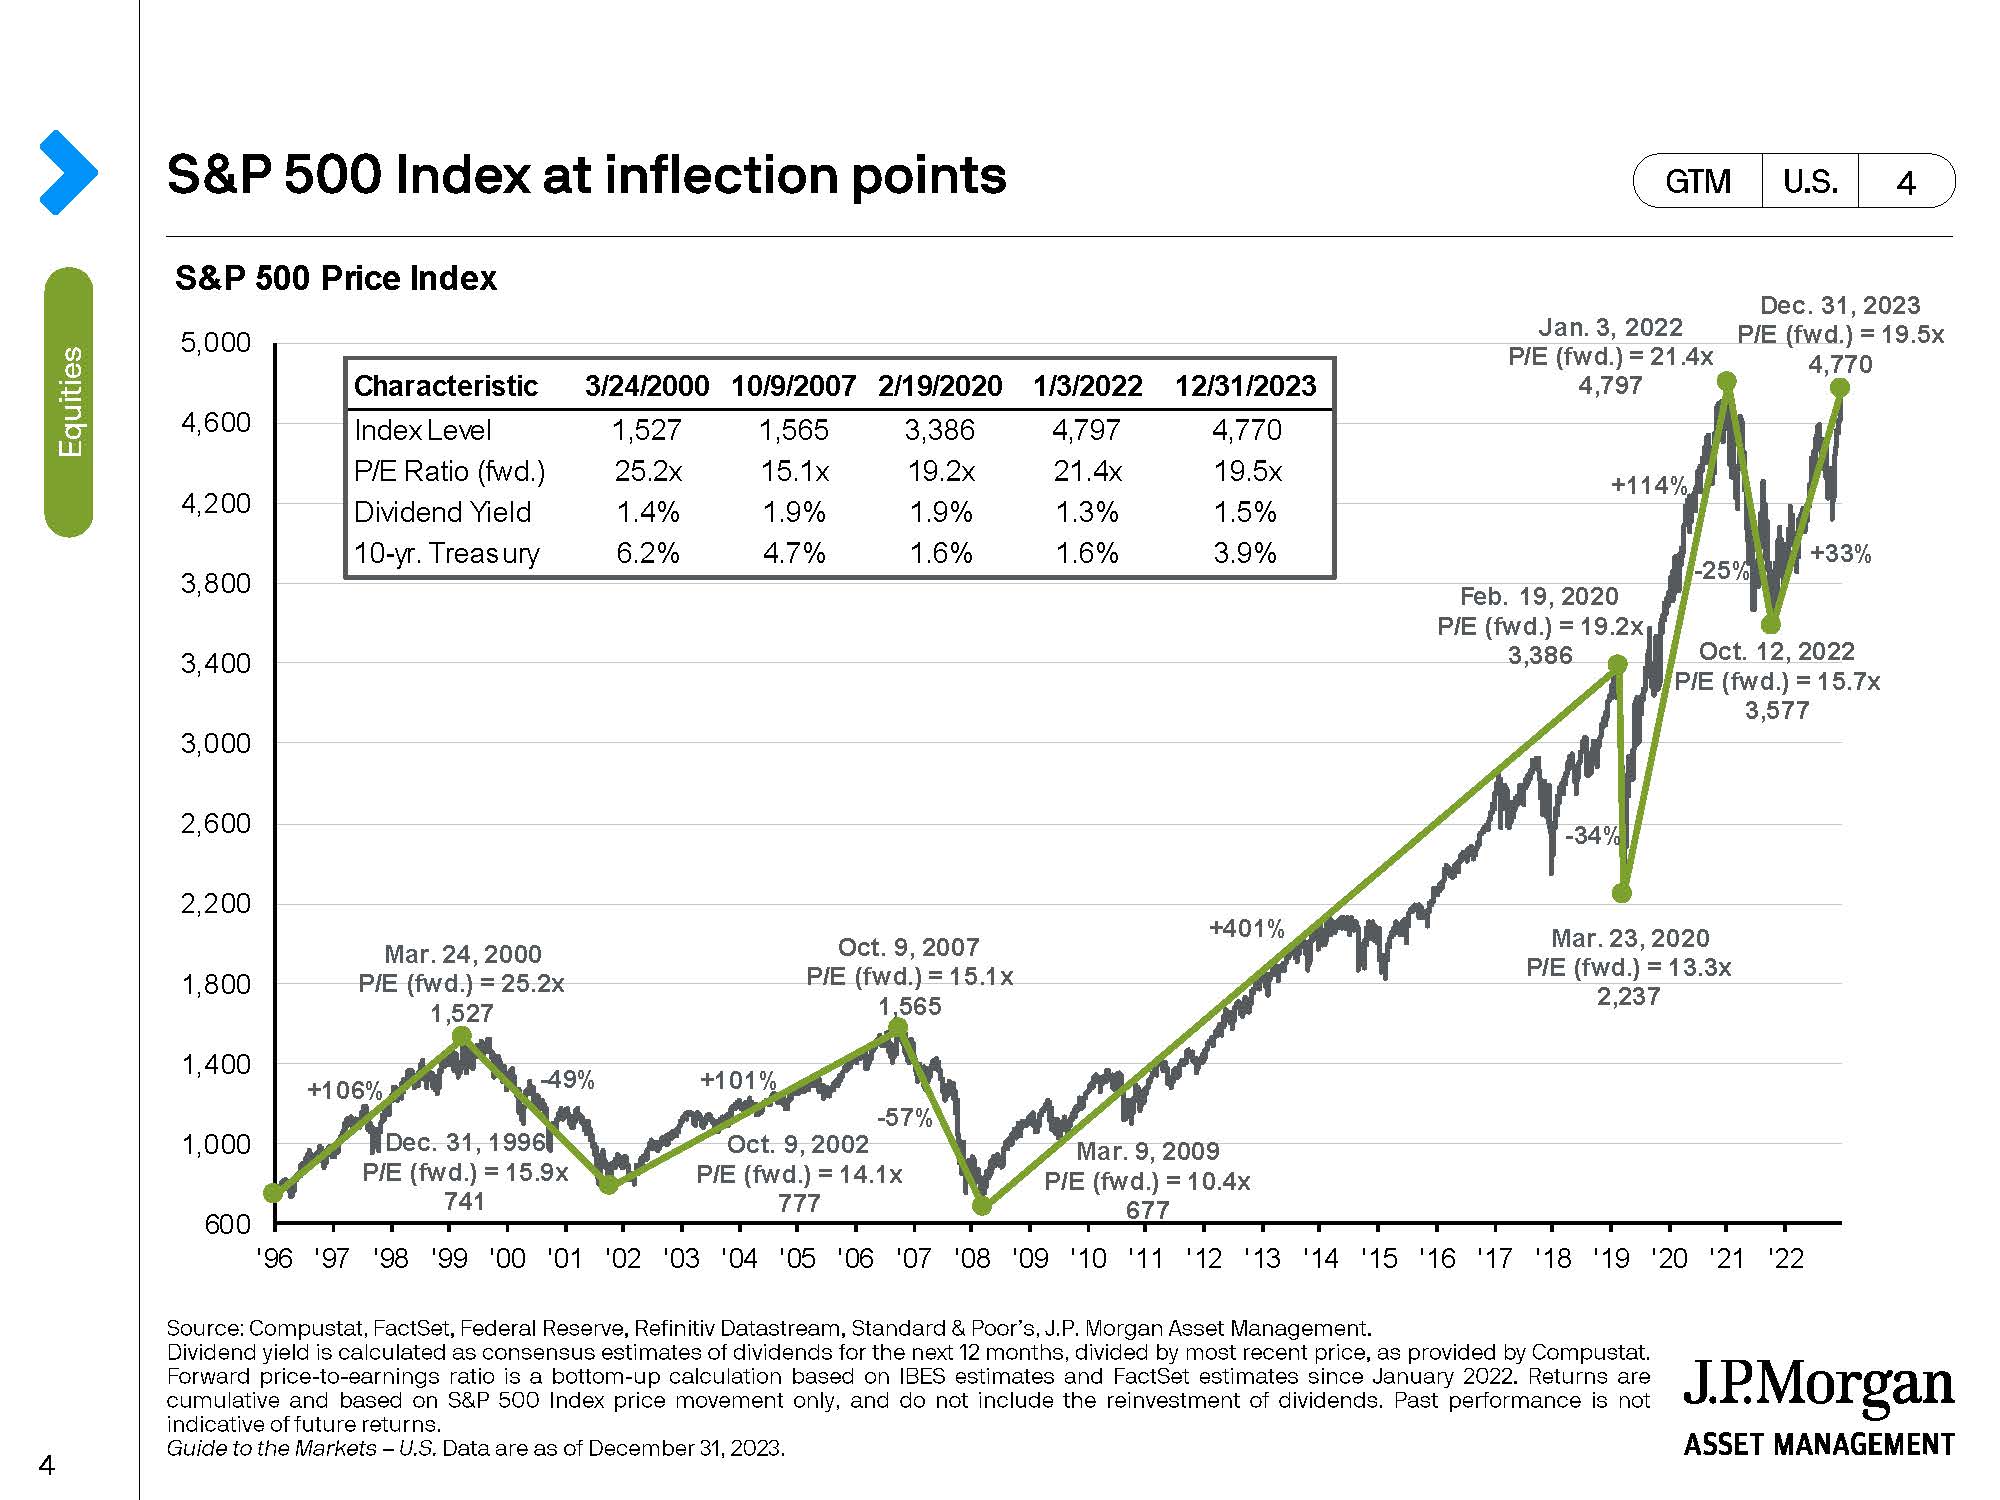
By comparison, the S&P 500 is trading now at a forward P/E of around 21X (17% cheaper on this basis than in 2000) with a dividend yield of 1.4%. Today the 10-year Treasury is yielding slightly over 4% (about 35% cheaper) vs 6.2% in 2000. The Fed has not yet reduced interest rates, with a Fed Funds rate still at a 5.25% level. So, a very loose monetary policy which was extant in 1999 and helped fuel that rally is not yet apparent. Further, as mentioned earlier, robust earnings and record free cash flow are underpinning today’s stock prices. This is particularly true amongst technology platforms which are adept at converting revenue into free cash flow. Certainly, there are stocks today that are priced expensively – but there are many more which are not. Also, when taken as a whole, the market today is not as expensive as it was in 2000.
Let’s go further back in time to the “Nifty Fifty” bubble of the 1970’s. This was the time of so called “one decision” stocks, like Polaroid, Eastman Kodak, Kresge (Kmart) and McDonald’s. The only decision one had to make was to buy these “forever” winners.
CHART 2
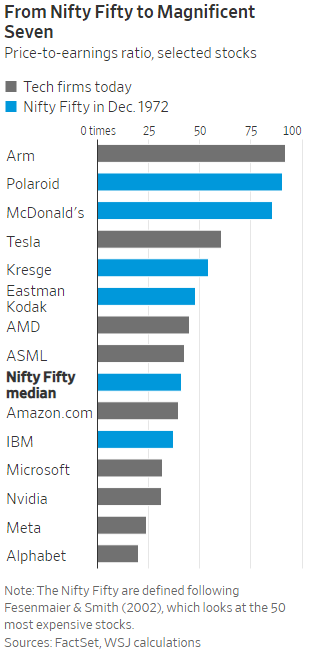
As can be seen in the chart above, six of today’s “Magnificent Seven” are listed and 5 of them have a lower P/E ratio than the Nifty Fifty median. Stock prices of some of the most expensive stocks today are expensive – but not as expensive as stocks have been in the past.
Our contention is that the S&P 500 is expensive, perhaps not as expensive as some other historical examples, but expensive. More importantly, if an investor digs down into the market – below the capitalization-weighted surface, below the “Magnificent Seven” – value can be found. There are many stocks which have not zoomed to bubbling heights but have been left behind because they are not obviously connected with catchy Artificial Intelligence (AI). Yet with an economy which is still strong and with the imminent prospect of interest rates being lowered, we think that there remain opportunities to make money. We are in the camp that believes that the leadership in the markets will broaden – that instead of just seven stocks leading the way to new market heights, it will be more like 300 stocks taking investors along. Tactically it might be smart to take some gains in the “Magnificent Seven” and rotate those funds to some equities which have lagged comparatively in the markets.
It is always uncomfortable to invest at perceived market tops. Let’s look again at Chart 1. In March of 2000, the S&P 500 hit a top of 1527. As of December 31, 2023, the S&P 500 stood at 4770 – with many other ‘tops” between these two marks. After seeing a big move up in stock prices and fearing that one has missed out on the easy money, most investors are reluctant to buy at the top. A popular rationale is to wait for a correction, a drop in prices. Quite often there is another chance to buy at a lower price – but some investors then wonder if the price at which they might buy is really the bottom or is there more downside to come. A successful investor is a disciplined investor – investors who stick to their investment strategies and allow the magic of compounding returns to grow their portfolios by being a long-term investor. In the US, the stock market over its long history has gone up about 70% of the time. As we have said numerous times in the past, this is the “house bet” and we always like to bet with the house.
WHERE ELSE TO INVEST??????
Over the years, we have commented on equity markets outside of the US. There have been periods of significant international equity outperformance vs. the US as can be seen in Chart 3 below.
CHART 3
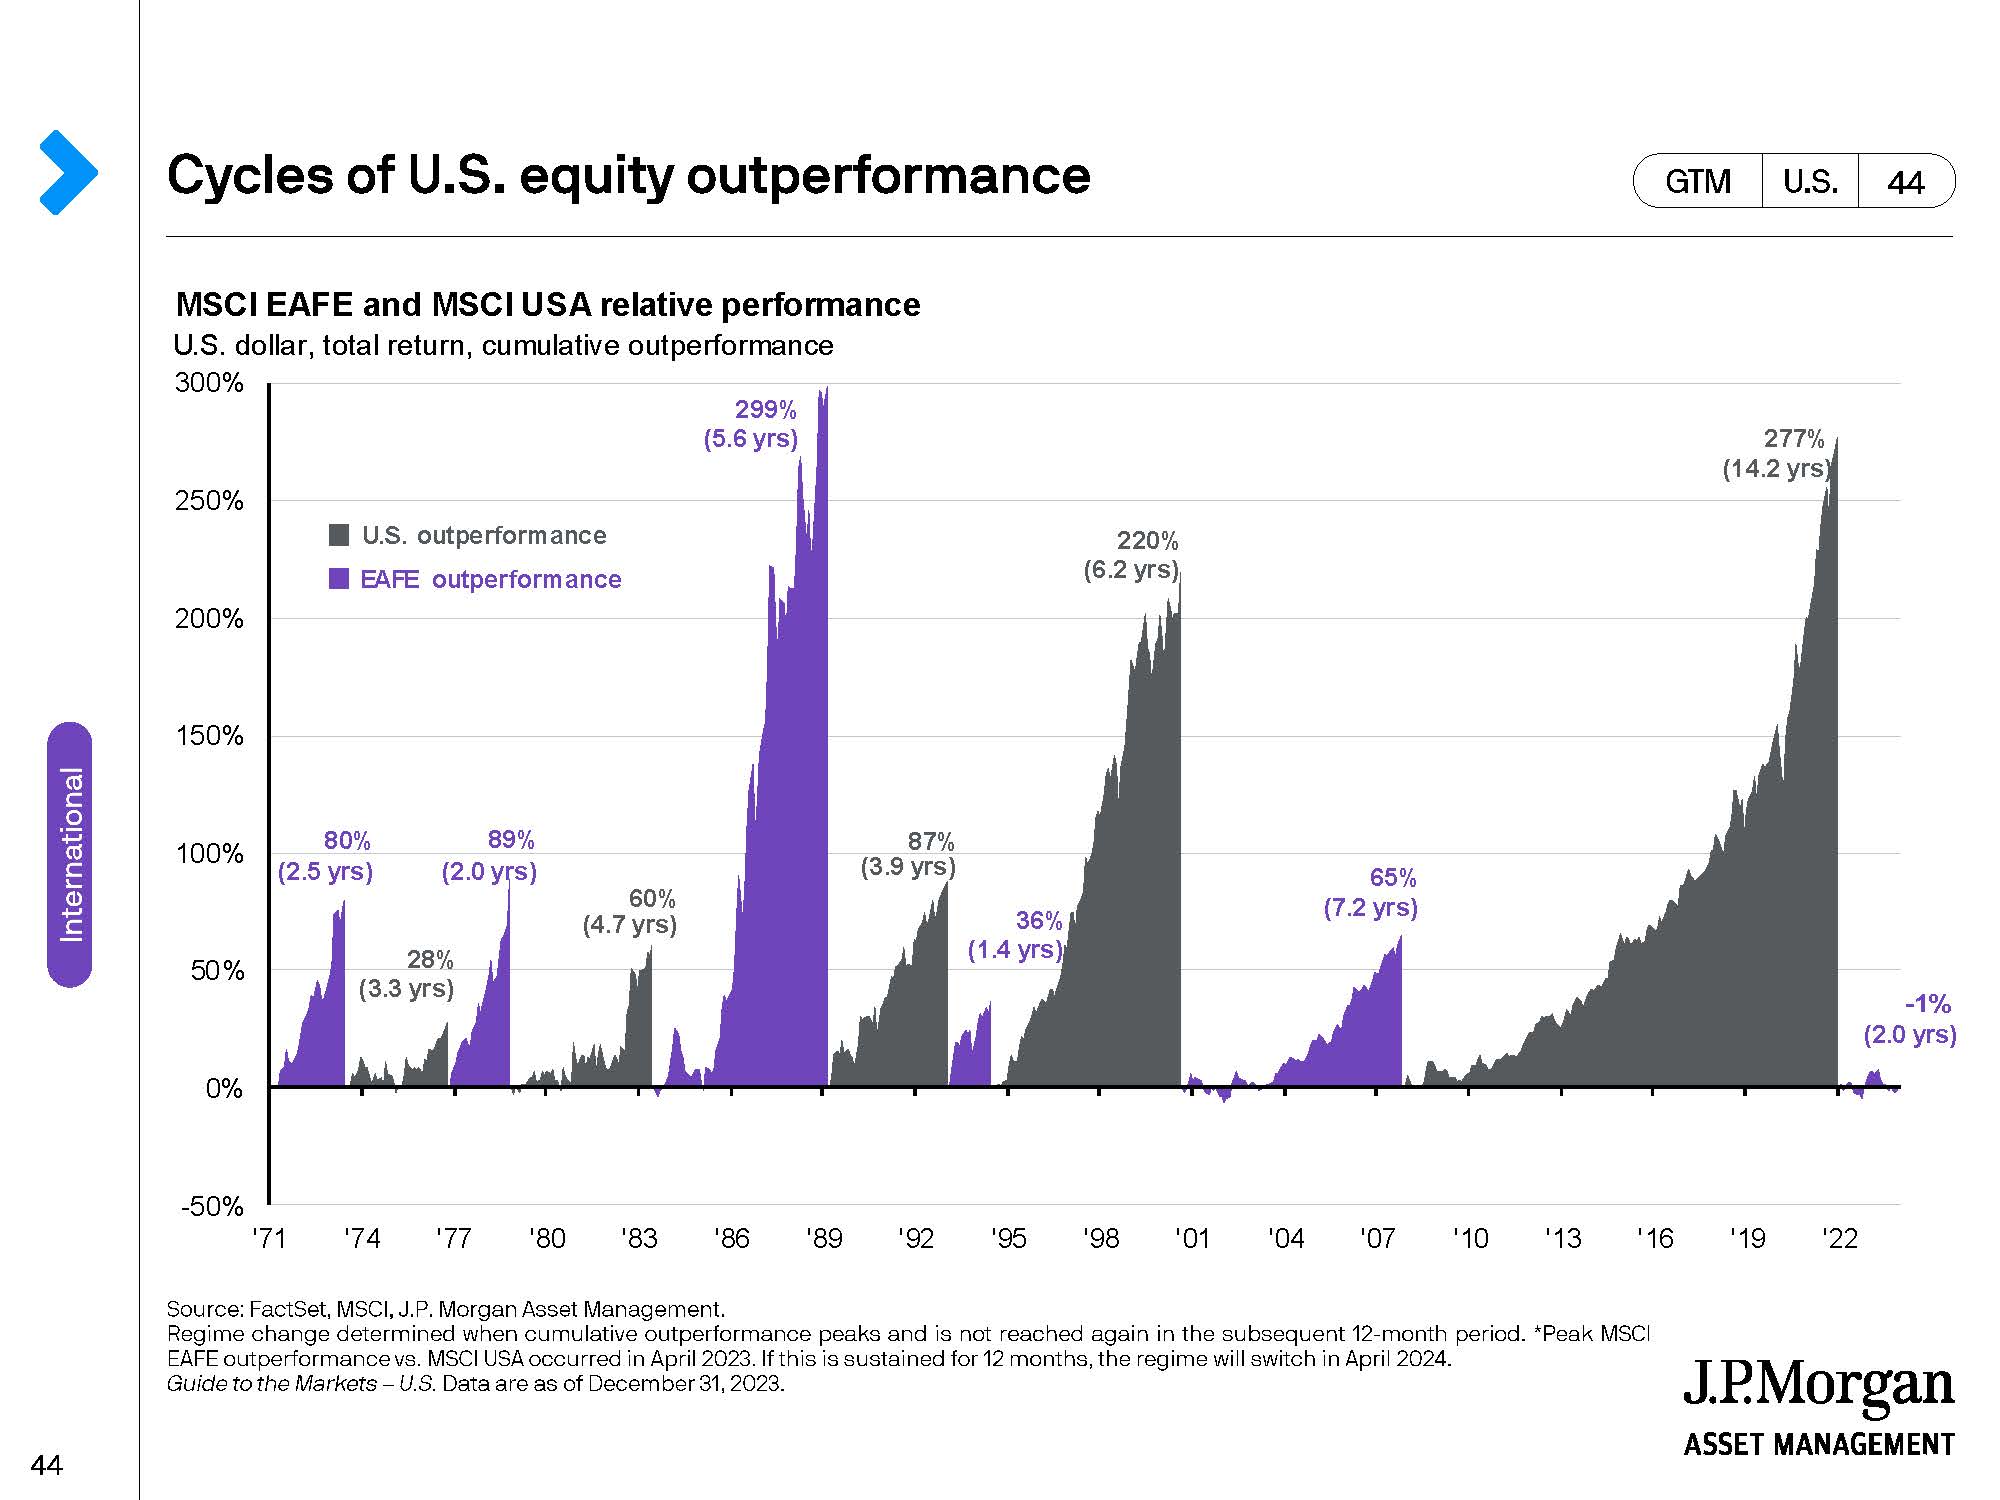
So, it is certainly possible to make money outside of the US. From a valuation perspective, markets ex-US are cheap in the extreme. In the following two charts, which reflect values as of 12/31/23, international stocks trade at P/E ratios two standard deviations cheap to the S&P 500, with dividend yields two standard deviations richer than the S&P 500:
CHART 4

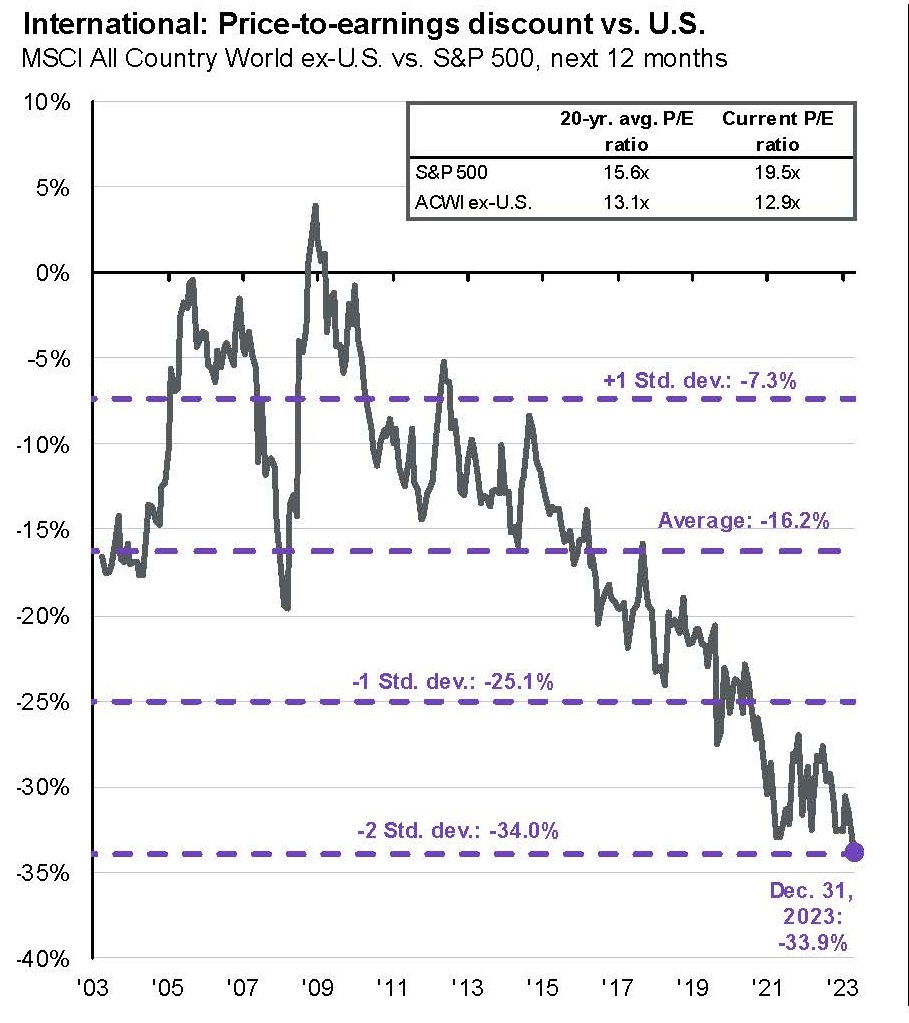
CHART 5
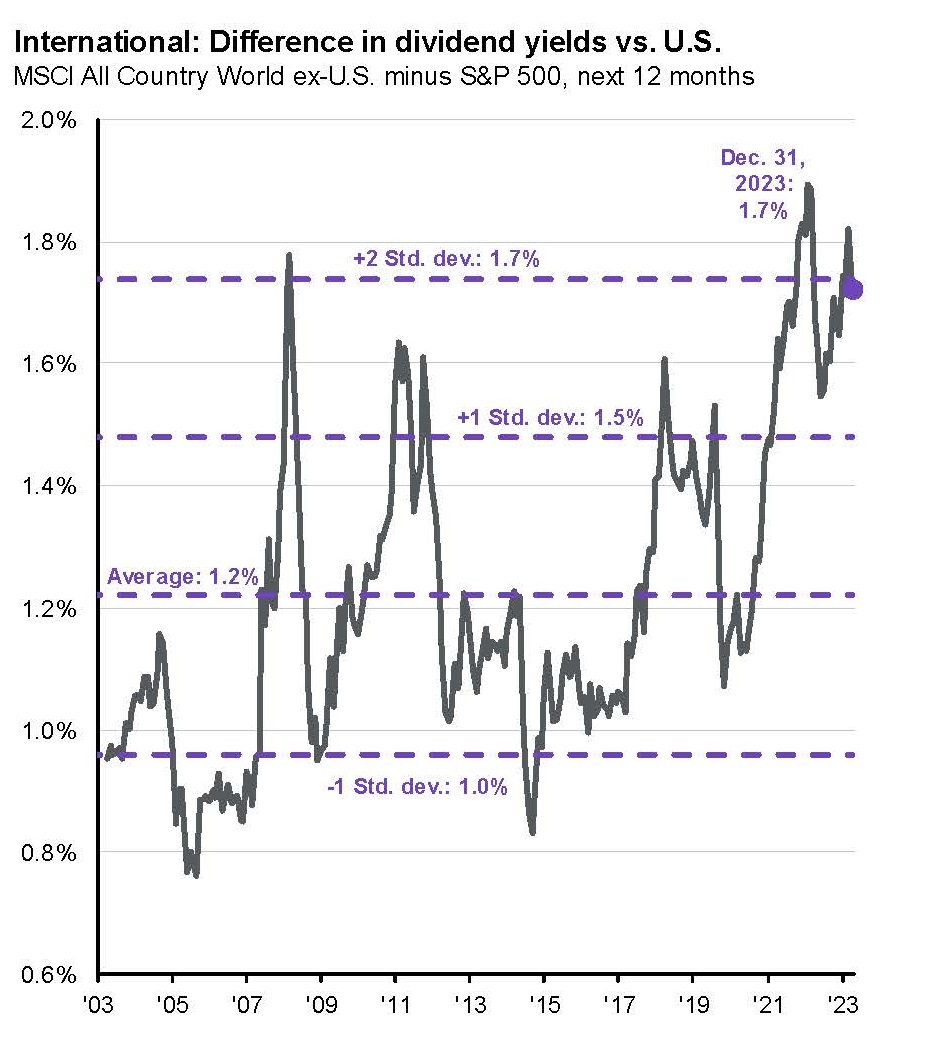
 These diagrams above are included to simply make the case that there may be real opportunities to find value elsewhere in the world. There is no reason for an investor today to be only investing domestically. We are also not suggesting that an investor simply buy the Indian market or the UK market. We are suggesting that in already inexpensive stock markets around the world, there will be attractive individual names in which to invest that can be bought at lower P/E ratios and come with higher dividend yields.
For example, here are some comparative companies which are in the same business, headquartered in different parts of the world, exposed to economies with different growth characteristics:
Airbus (French) vs. Boeing
Boeing has long been the worldwide leader of the aerospace industry. Airbus is today. Boeing’s stock sells at 54X earnings and pays no dividend. Airbus’ stock sells at 23X earnings and has a 1.1% yield.
Ryanair (Irish) vs. Southwest Airlines
Southwest created the model for the successful low-cost airline. Ryanair followed Southwest’s lead but did it successfully in Europe. Southwest’s stock sells at 18X earnings and has a 2.6% yield. Ryanair’s stock sells at 15X earnings and has a 0.7% yield.
Walmart de Mexico vs. Walmart
Walmart de Mexico is a subsidiary of Walmart, covering all of faster growing Latin America and headquartered in Mexico. So, an investor gets all the benefits of Walmart’s expert management in the faster growing manufacturing reshoring center for the US – Mexico. Walmart’s stock trades at 26X earnings with a 1.4% yield. Walmart de Mexico’s stock sells at 20X earnings and has a 3.8% yield.
These are but a few examples of our point. Many great companies are headquartered in the United States – but many are not. An opportunity not taken is an opportunity missed.
A FINAL THOUGHT…