
FIRST TO FUNDAMENTALS – THEN A LOOK UNDER THE HOOD…
Our investment research touchstone is always “fundamentals first.” How is the economy doing? How are companies conducting business in that economy faring? Finally, we look at the markets – what are investors (who make up the markets) doing? What are they telling us?
The US economy continued to advance in the second quarter of 2026. With about 2% growth in GDP (Gross Domestic Product), progress was not robust, nor was it flagging. Inflation was persistent, measured at >3% for both the PCE (Personal Consumption Expenditure, the Fed’s favorite index) and the CPI. Employment was strong with recent revisions to the upside, supplanting some earlier disappointing numbers. Unemployment rests in the 4% range, which is historically low. With employment strong and inflation still a nag, the Federal Reserve just raised the Federal Funds rate by 25 BPS to a range of 3.75-4.00%. Is an interest rate hike necessarily a bad thing? Making money more expensive by raising interest rates is never beneficial for borrowers – but a great thing for savers and lenders. We believe the American economy is strong enough now to absorb this modest increase and perhaps another one or two 25 BPS increases spread out over the rest of this year and into early 2027. Further, such a small bump in rates may bolster the bona fides of the new Fed Chairman, Kevin Warsh, which got a bit banged up after his first news conference. So much of monetary policy’s effectiveness is based on market trust that the Fed is “on the job.” A small jump in rates now might do the trick. All in all, the economic backdrop continues to be quite positive for investors.
Corporate America had a strong second quarter of 2026, significantly exceeding Wall Street expectations for earnings and revenues. S&P 500 Index company revenues were +15.5% from a year earlier, and earnings rose 53%, trouncing projections of a 23% increase. This performance was the best, outside of recoveries from major recessions, in Bloomberg Intelligence data going back to 1992. According to Fact Set (a well-known research outfit), 86% of the S&P 500 companies reporting beat analysts’ earnings estimates; 77% exceeded sales estimates; and 71% beat both earnings and sales estimates. Following an already robust first quarter, S&P 500 member companies are on track for having the strongest earnings for the first half of a year since 2021. Further, booming profits are prompting strategists to lift full year S&P 500 forecasts, and consensus earnings are expected to grow 27% vs. a 15% estimate at the start of 2026. With such a corporate profit setting, would there be a chance of a recession?
CHART 1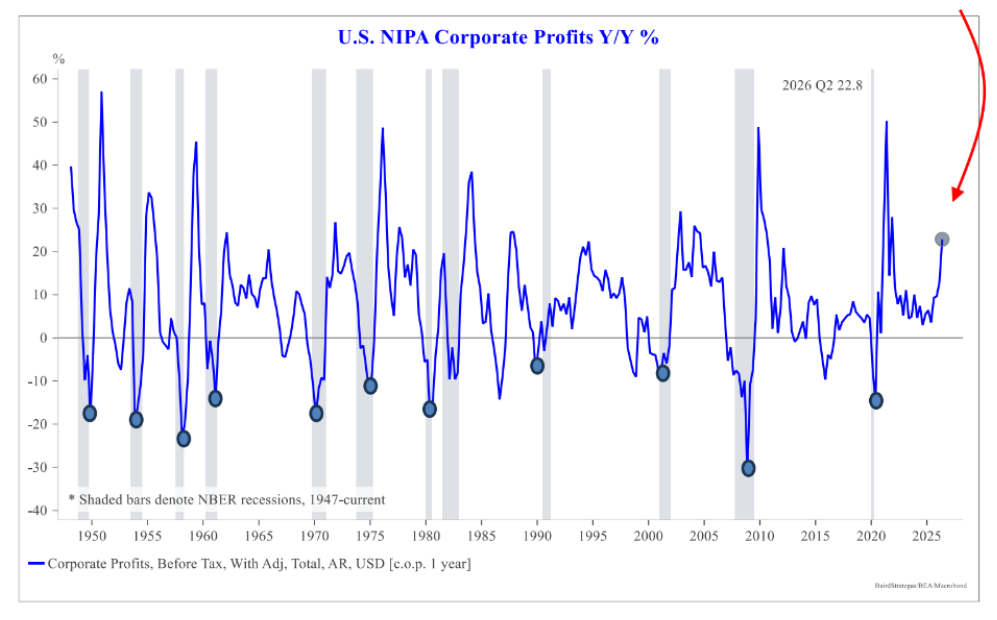
As can be seen in Chart 1 above, there has never been a recession with positive profit growth year over year.
So why has corporate growth been so strong? A very important factor has been surging profit margins. We have written about this numerous times in the past, and it continues to propel corporate America. Historically net income margins struggled to best high single digits. Regulation changes, along with the advent of AI (Artificial Intelligence) have contributed to an approximate 15% boost in net margins in the US. In Europe, profit margins have risen to about 12% along with economic growth and AI-related cost savings. MSCI Europe Index constituents increased second quarter earnings by 14% in Q2, with 54% beating earnings estimates. This was the best profits showing since 2022, according to Bloomberg Intelligence, and full year profit estimates are expected to be +17.8% according to research firm ETF Trends.
Now that we have mentioned AI, let us spend a little ink on some fundamental facts about AI. To lay out the obvious, AI is being increasingly used by people in their daily lives and their work. According to Morgan Stanley Research, the use by consumers of AI tools daily for personal purposes in August was 26%, up from 19% in January (an increase of 37%) and for daily work, 27% vs. 20% (an increase of 35%).
CHART 2
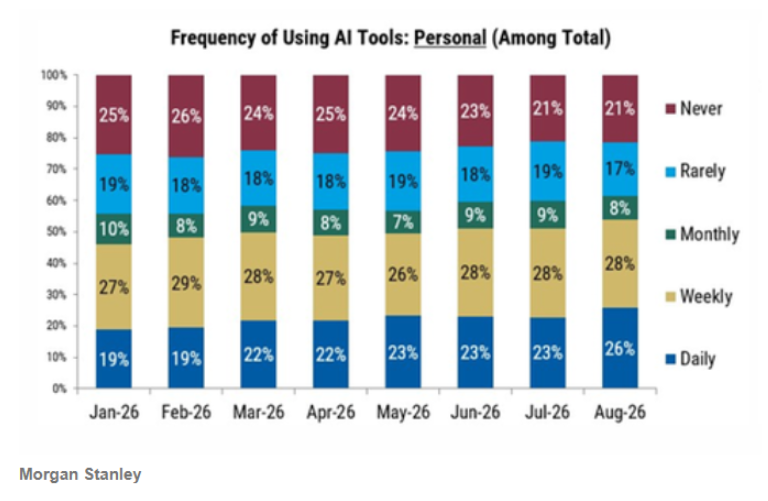
CHART 3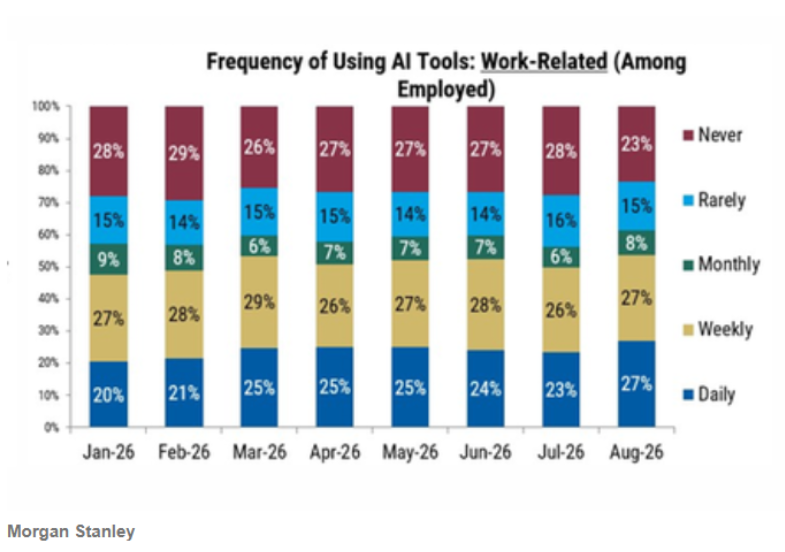
Importantly, younger consumers remain the most frequent users. Moreover, AI infrastructure companies right now are carrying a great deal of the earnings uplift on their corporate shoulders. Goldman Sachs estimates that fully one third of Q2 S&P 500 earnings was contributed by AI infrastructure firms (the “Mag 7”, including Alphabet, Microsoft, Amazon, etc.) and they could generate more than half of the S&P’s earnings growth for the remainder of 2026. But Goldman argues that corporate wealth is broadening, with expanded profit margins and faster growing earnings spreading across corporate America (ie., in industrials, healthcare, energy, etc.) and not just in information technology. With the advent of any major new technology, Wall Street is often too quick to bet against the breakthrough if results are not rapidly apparent. Recently the St. Louis Fed highlighted in a study that personal computers, software, and the internet did not immediately show meaningful labor productivity growth in initial 1990s economic data. It was only later in subsequent reports that after large revisions upward, the case was well demonstrated that those technological breakthroughs created significant productivity enhancements.
CHART 4
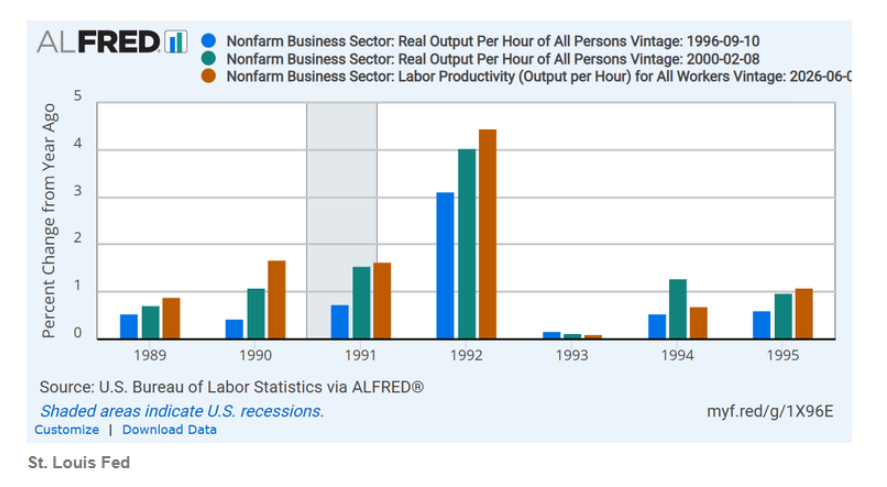
Often, official measurement lags the technological frontier. Exampled in a more current fashion, please find an interesting chart from S&P Capital, which measures the gap between hyperscaler technology companies’ (think Amazon, Alphabet, Microsoft) share of total market capitalization and their share of aggregate corporate earnings.
CHART 5
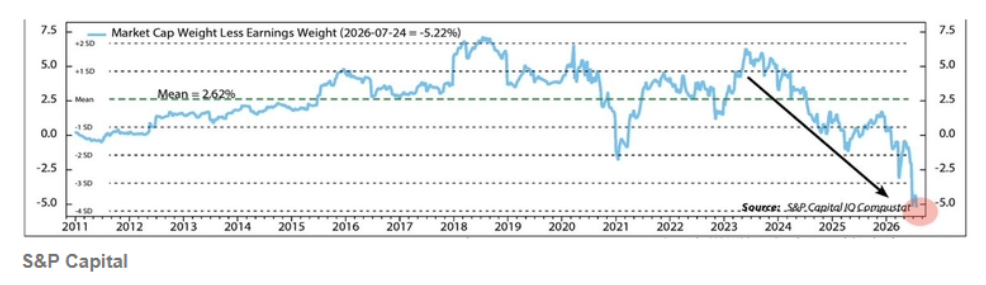
A negative number suggests that the hyperscalers’ earnings weight is greater than their market cap weight, which in turn would indicate market skepticism about hyperscalers and AI. Patience is a virtue, and in our opinion, these companies seem inexpensive relative to their earnings growth potential. Further, with S&P 500 earnings growth outpacing the advance in the market, the benchmark is now trading at 19.6 times forward earnings. At the beginning of 2026, the S&P 500 was trading at around 26X forward earnings. So despite some advance in the stock market so far in 2026, on a relative basis to earnings, the market has only gotten cheaper.
A LITTLE LOOK UNDER THE HOOD……
After a thorough examination of fundamentals, we also look at what fellow investors are telling us about their perspectives on a market, and we do this using technical analysis. Here we are concerned only with what prices and price patterns in markets are telling us. Those price movements relay other investor ideas about a market or a security or a commodity, and there are analysts who formulate tactics and strategies only through watching changes in prices and the patterns they form. So while we are constructive about market fundamentals, let us look at what others are thinking via technical analysis. A recent look at the S&P 500 shows that 68.4% of the index’s companies are priced above their 200-day moving averages, considered a longer-term market breadth analysis. Similarly, 53.1% of the S&P 500 components trade above their 50 moving average and 46% exceed both averages. These are good signs that the S&P 500 is well supported from a technical perspective – it has good breadth. It is not “narrowly led” – ie., more companies than just the “Mag 7” are trading higher, which suggests broadening enthusiasm for the economy and corporate America. Further, when one looks at a ranking of industries according to their 50 day and 200 day moving averages, one sees a picture of investors rotating among corporate groups (like moving from information technology to energy or energy to healthcare – but not moving from stocks to bonds). From our perspective, this also is a healthy sign.
In sum:
- The American economy had a good second quarter of economic growth
- Unemployment continues to be low
- Inflation remains “sticky”
- The Fed could modestly raise interest rates, which the economy could handle
- Corporate America is doing very well, as are European firms, surprising analysts to the upside
- Margins are exploding upwards
- AI and some rule changes are contributing to rising margins and earnings
- The S&P 500 is cheaper today than at the beginning of the year on a forward earnings basis
- Technical analysis suggests broadening support for the S&P 500 by investors.
A Final Thought…
The opinions expressed in this Commentary are those of Baldwin Investment Management, LLC. These views are subject to change at any time based on market and other conditions, and no forecasts can be guaranteed. The reported numbers enclosed are derived from sources believed to be reliable. However, we cannot guarantee their accuracy. Past performance does not guarantee future results. This commentary is for information purposes only. Nothing herein should be construed as investment advice or a recommendation to buy or sell any security. Forward-looking statements are based on current assumptions and are subject to change. A current copy of our ADV Part 2A & Privacy Policy is available upon request or at www.baldwinmgt.com/disclosures.
 Peter H. Havens, Chairman
Peter Havens founded Baldwin Investment Management, LLC in 1999 after serving as a member of the Board of Directors and Executive Vice President of The Bryn Mawr Trust Company. Previously he organized and operated the family office of Kewanee Enterprises. Peter received his B. A. from Harvard College and his M. B. A. from Columbia Business School. He serves as Chairman of the Lankenau Institute for Medical Research. He is a Board member of AAA Club Alliance, Main Line Health, The Lankenau Medical Center Foundation, and the former Vice Chairman of Main Line Health. He is a Trustee Emeritus at Ursinus College, Chairman Emeritus of the Board for the Independence Seaport Museum, former Trustee of the Leukemia Society of America, and a former board member of Main Line Health Realty and Lankenau Development Inc. He was also the Chairman of the Board of Petroferm, Inc. and a Board member of Nobel Learning Communities Inc.