Let’s start our final Commentary of the year with a look back at the planks of our investment rationale for 2025, which we authored in late 2024.
1. Corporate earnings are expected to increase some 12% – 14% in 2025;
2. Dividends are presumed to increase apace;
3. Company management teams will work to maintain /improve profit margins;
4. Greater investment in and use of artificial intelligence (AI);
5. Interest rates are slated to decline perhaps another 50 basis points;
6. Unemployment should range between 4% – 5%;
7. A more accommodative regulatory environment is expected for US businesses;
8. Previous tax cuts will be maintained with some new introduced;
9. Tariff use may rise;
10. Deficits and government debt will become a focus of investor attention.
We thought that the above would provide investors with a favorable framework in which to work during 2025 and produce positive investment results. Fortunately, it did, and many markets around the world, especially those outside of the US, had a good year of returns for investors. So, what about 2026 – how is it shaping up as a time to invest? Let’s start with the American consumer, the most important force in the US economy – representing about 70% of US GDP (Gross Domestic Product). In the following charts, all of which we have used previously, the reader will note that the American consumer still has a very strong balance sheet, with a net worth of $176.3T, a household debt service ratio of 11.3% as of the end of Q3 2025, and loan delinquencies which seem moderate, except for student loans.
CHART 1
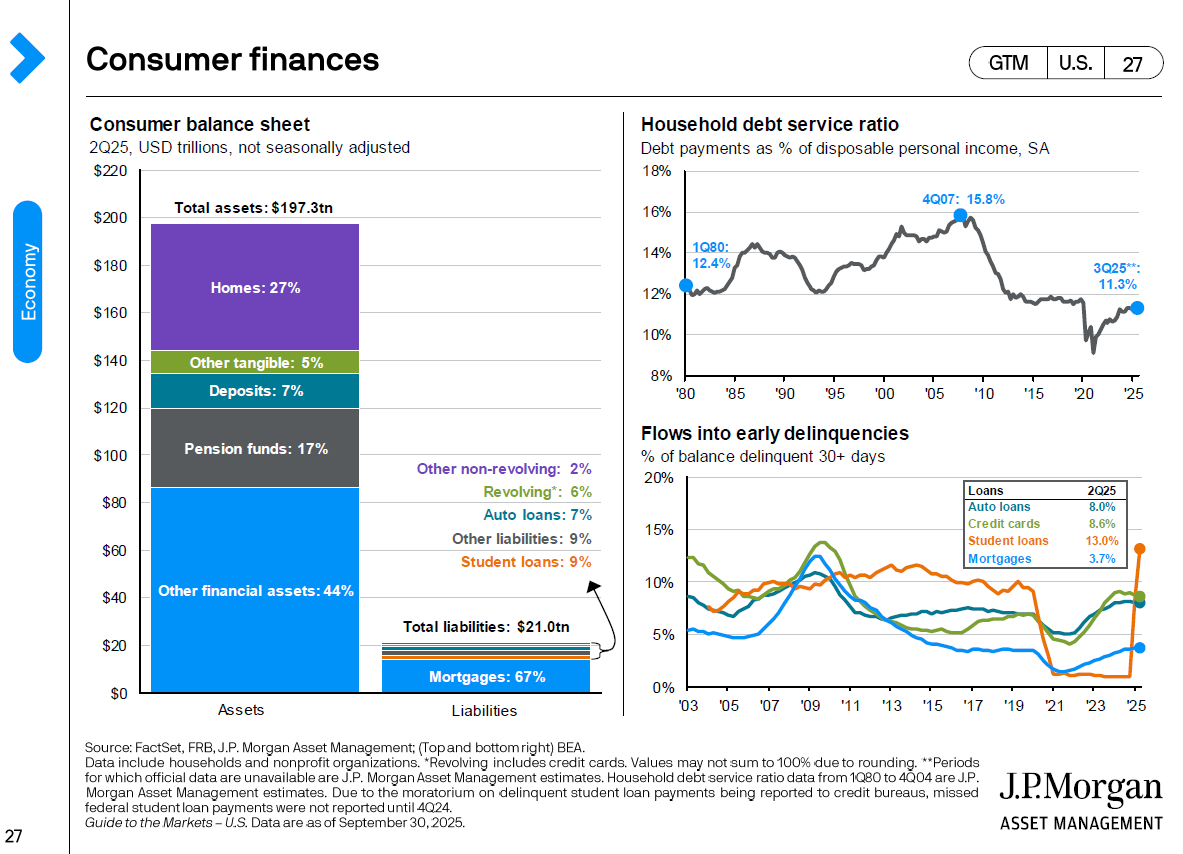
While rising very recently, unemployment in the US is still historically low, just shy of 4.6%. So the vast majority of people are earning money and as we have written about in the past, the American consumers will spend what they earn. They may not feel good about their situation while they’re spending. They may complain about their situation while they’re spending. Nevertheless, Americans will spend. The following is an interesting chart which looks at the interrelationship between consumer sentiment and S&P 500 returns.
CHART 2
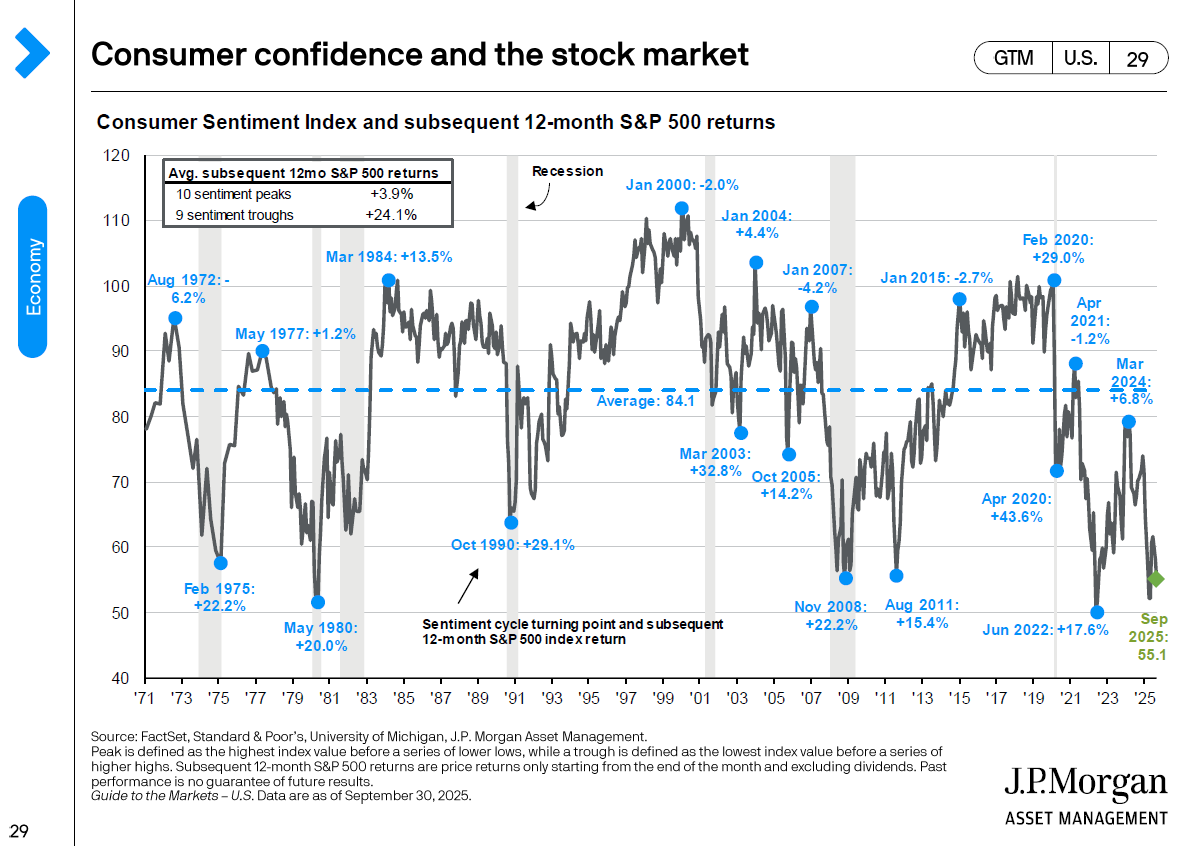
Here the reader will note that at trough points of consumer sentiment (within a range of 50 to 60 as a consumer sentiment score from the University of Michigan) there usually occurs a major market rally. As one looks to the far right of the chart for the latest data, the most current score is 55.1. Such a sentiment level has been historically supportive of US stocks.
Besides the consumer, let’s look at other legs of the American economic stool to see if there are any wobbly ones.
CHART 3
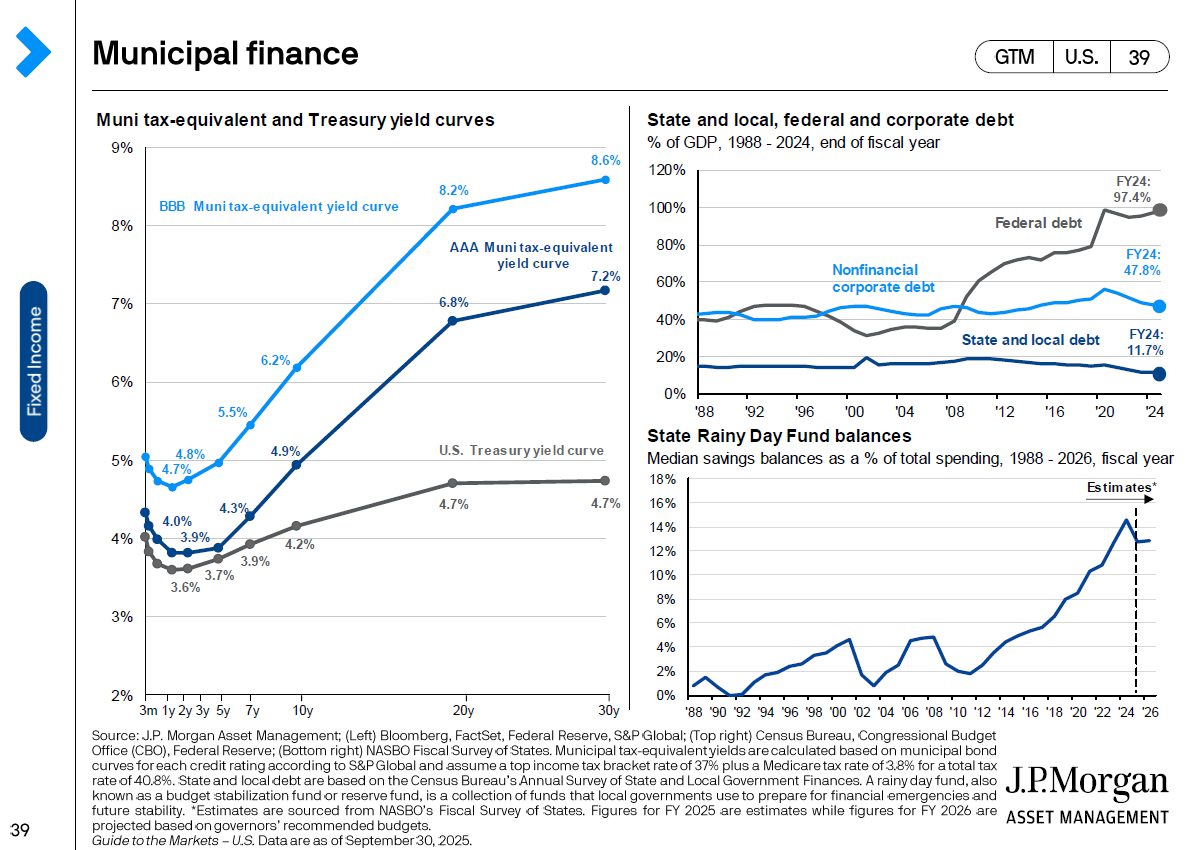
In the charts above, the relative balance sheet health of corporate America, state and local governments and the Federal government are laid out in simple terms. Nonfinancial corporate debt from 1988 until recently has stayed relatively flat as a percentage of GDP, as have state and local debt. In fact, in the lower chart outlining state “rainy day” funds, it looks as though state and local entities have been actively saving for a “rainy day”. Not so with regard to the federal debt pile which has only been growing – now approximating 98% of GDP. So, comparatively, the “wobbly leg” is the federal government – a subject we have written about several times in the past, voicing our concerns about the value of the US dollar and its position as the world’s reserve currency.
With the consumer still in good financial shape, with corporate America still looking healthy, and with state and local governments still appearing fiscally robust, the overall picture for America looks well positioned for another year of economic growth which would support higher stock prices. The only mar to this outlook is the American federal debt situation. If there were to be a shock to our economy, if investors lost faith in US Treasuries, that might be the weak link which could upend what otherwise might be another good year in the markets. We do not expect this outcome – but this is our primary vulnerability.
Up from the economic foundation, let’s think of other forces which could help or hurt asset prices in 2026. Interest rates we believe will continue to edge down – but not quickly or dramatically. As tariffs are being implemented today, with plenty of exceptions and loopholes, inflation should stay under control. It will not dissolve to zero or even to the Federal Reserve’s explicit 2% target. But inflation in 2026 should not cause interest rates to rise. So, lower interest rates will be supportive of bond and equity prices. Company earnings are expected to increase 13% next year. Lower regulatory burdens will be helpful to companies. Throughout 2025 there were corporate announcements of new industrial building projects that are slated to come on stream in the near future – with several already being constructed. This new investment in American infrastructure and the prospect for related employment opportunities will bolster company results as the new plants manufacture products to satisfy American demand. Moreover, projects are progressing to final investment decisions more quickly, saving time and money. Corporate profit margins should be maintained, perhaps enhanced, due to lower operating costs as AI is applied throughout enterprise ecosystems. With more cash flow, dividends should be increased for another year.
While the aforementioned would support higher asset prices in markets, valuation itself might not support higher prices. Markets have moved sharply higher in 2025 after strong years in 2024 and 2023. Investors reasonably wonder if there is another “up” year in the cards or might markets be in for a year of consolidation. It could be that 2024’s leaders (i.e., the Magnificent 7) no longer drive market gains. Their stock prices could remain stuck in the short term because too many investors think that they have gone too far too fast – that they have become too expensive despite their robust, Wall Street beating results and very bright futures. Consequently, there may be P/E (price/earnings) multiple compression. What investors were willing to pay 26x earnings for previously now becomes 22x earnings. We have already seen hints of this as companies such as Nvidia and Broadcom have declined in price after announcing quarterly earnings that solidly exceeded expectations, and whose managements expressed great confidence in the future for their businesses. This phenomenon happens when too many investors believe that while a company’s future may be bright, there could be “bumps in the night” which will upset an anticipated smooth trajectory into the future, especially when valuations are high. This is simply a process wherein a company grows into its stock price. Some investors will tactically trim positions to reduce portfolio volatility. Others will look through the possible price turbulence and hold their positions. Fundamentally, the companies are doing fine. It just may be that for a short time their stock prices are mired and not as reflective of a bright future as they once were. But high prices, in the long run, will not cap future price gains if an economy and its companies are growing. In support of that notion, please refer to the following charts.
CHART 4
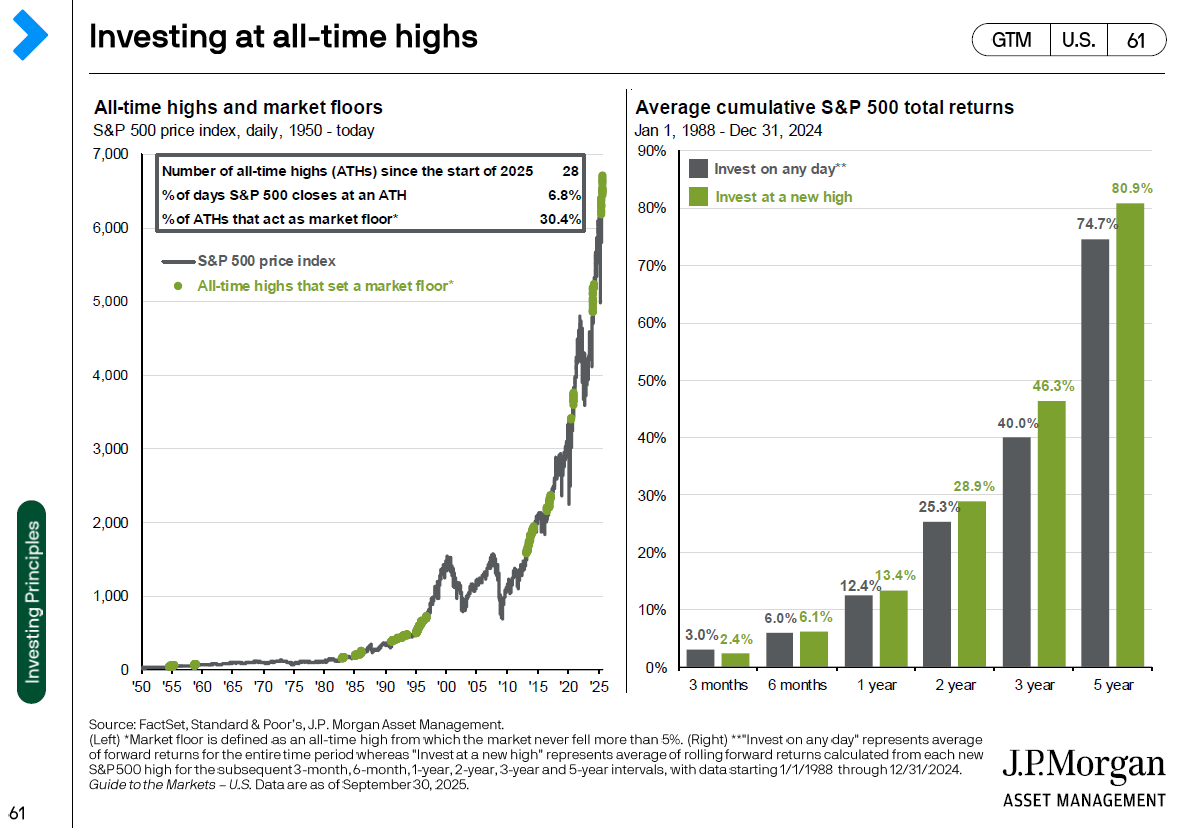
On the left-hand side, the reader will note a chart that depicts all-time highs and market floors. There were 28 all-time highs through the first nine months of 2025. Further, 30.4% of the time, a new all-time high then acted as a market floor. In the right chart, average cumulative S&P 500 total returns are displayed from 1/1/88 – 12/31/24. In each instance, from a 1-year time frame to a 5-year time frame, if one invested at a new high, an investor always made money and outperformed an investor who invested on any day – who also made money, I might add. The message is simple – invest your money and let time unleash the power of compounding. “Time in the market is more important than timing the market” is a popular adage for good reason!
Overseas, equity markets had a good run in 2025. Out of the top 20 markets this past year, 10 are from Europe, and the US is not included in the group.
CHART 5
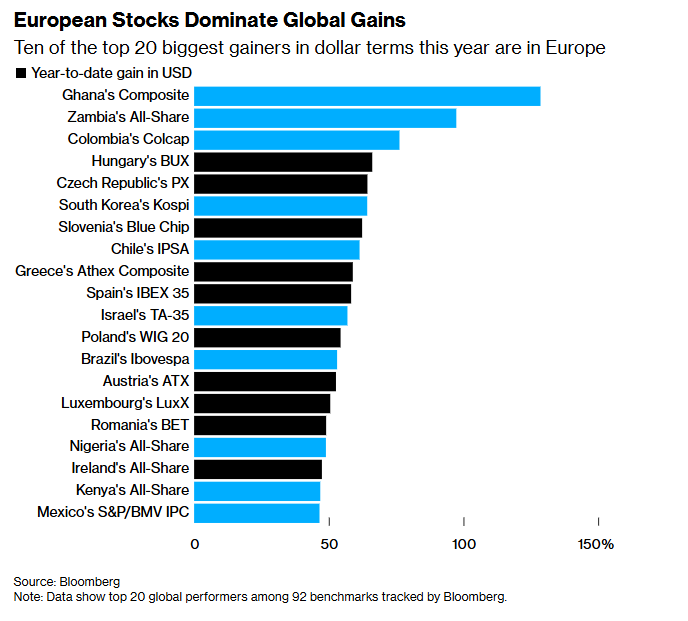
There is still enthusiasm for foreign equities. Part of the rationale is a diversification out of the US dollar, which has been weak throughout 2025 and looks to continue its slide against other currencies. Part of the rationale has to do with relative valuations -with European and Asian markets, even after last year’s rallies, still valued on a P/E (price to earnings) basis as inexpensive (trading at a 35% discount) as compared to US stock markets, as pictured in Chart 6 below.
CHART 6
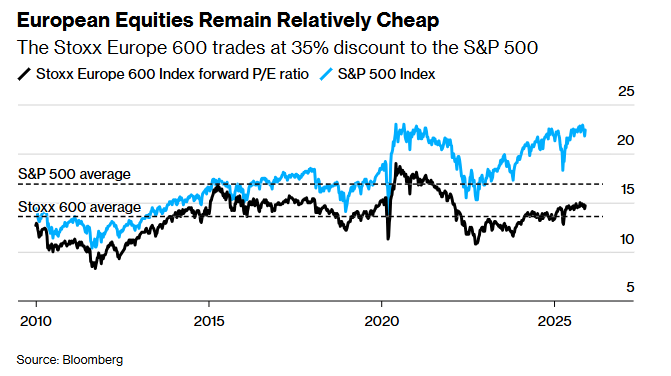
Further, interest rates are lower in Europe, making European stocks relatively more attractive than American stocks. Economic growth rates are higher in Asia, as are corporate growth rates. India’s GDP may grow 8% in 2026. Taiwan Semiconductor is the major manufacturer of Nvidia semiconductors – but trades at a fraction of Nvidia’s value. For years, we have strongly advocated international investing. But for a long time, it was not fashionable. The worm may have turned.
We want to carry points 1 – 7 along with point 10 on the first page of this Commentary from 2025 to support our investment rationale for our 2026 outlook, as they remain timely. As to point 8, tax cutting is finished for this political term and the benefits to some individual and corporate taxpayers will be measurable in 2026. The popularity of tariffs has varied by industry and constituent. For example, those who are in the metals business assert that tariffs are just what the country needs to level the playing field. Conversely, the imposition of tariffs on China spurred the Chinese to retaliate and cease buying numerous American agricultural products like soybeans. The Chinese switched their soybean purchases to Argentina and Brazil, whose farmers have benefited mightily. American farmers lost a major market. Further, tariffs were put on key imported fertilizer ingredients, which raised the cost of fertilizer – a very important input cost for farmers. So, US farmers, because of tariffs, had their input costs for soybean production increased dramatically while at the same time they lost a major market. To help, the US government is going to spend $12B of tariff money to subsidize the American farmer. Unfortunately for some farmers, bankruptcies are already on the rise. Also, tariffs in their current form may be judged by the Supreme Court as illegal. That decision has yet to be rendered. But since the new tax revenues have helped to offset recent tax bill accommodations, it is likely that the current Administration will re-cast any tariff declared illegal to maintain these revenues. Besides, with all the exemptions and allowances, the tariffs imposed so far have not in and of themselves created any measurable inflation, as importers, retailers and ultimately consumers have found enough flex in their respective budgets to absorb the new taxes. Tariffs will continue, but we do not think they will grow to be a bigger burden for American consumers. Lastly, deficits and Federal government debt will remain a focus of investor attention – especially bond and currency investors. This is the “wobbly leg”. We certainly don’t know when debt issues will become an intense focus for investors. But the dollar is declining in relative value against other major currencies. The greenback is losing market share in financing deals as countries and companies de-dollarize their portfolios of debts, and as investors diversify their assets by currency. So as long as the debt/dollar situation does not get out of hand over the next twelve months, there are numerous reasons for assets to appreciate in value.
* Attributed to Yogi Berra
ONE FINAL THOUGHT…

The opinions expressed in this Commentary are those of Baldwin Investment Management, LLC. These views are subject to change at any time based on market and other conditions, and no forecasts can be guaranteed. The reported numbers enclosed are derived from sources believed to be reliable. However, we cannot guarantee their accuracy. Past performance does not guarantee future results. We recommend that you compare our statement with the statement that you receive from your custodian. A list of our Proxy voting procedures is available upon request. A current copy of our ADV Part 2A & Privacy Policy is available upon request or at www.baldwinmgt.com/disclosure.
 Peter H. Havens, Chairman of the Board, Investment Portfolio Manager
Peter Havens founded Baldwin Investment Management, LLC in 1999 after serving as a member of the Board of Directors and Executive Vice President of The Bryn Mawr Trust Company. Previously he organized and operated the family office of Kewanee Enterprises. Peter received his B. A. from Harvard College and his M. B. A. from Columbia Business School. He serves as Chairman of the Lankenau Institute for Medical Research. He is a Board member of AAA Club Alliance, Main Line Health, The Lankenau Medical Center Foundation, and the former Vice Chairman of Main Line Health. He is a Trustee Emeritus at Ursinus College, Chairman Emeritus of the Board for the Independence Seaport Museum, former Trustee of the Leukemia Society of America, and a former board member of Main Line Health Realty and Lankenau Development Inc. He was also the Chairman of the Board of Petroferm, Inc. and a Board member of Nobel Learning Communities Inc.