Federal Reserve officials often refer to the Personal Consumption Expenditures Price Index (PCE) when justifying monetary policy decisions, and financial markets can swing dramatically based on monthly PCE releases. Yet despite its outsized influence, PCE remains less understood than the more widely recognized Consumer Price Index (CPI). What may surprise many investors is that PCE has been the Fed’s preferred inflation measure for over 25 years, and its ascendancy over CPI stems from fundamental methodological differences that profoundly affect how inflation is measured.
What exactly is the Personal Consumption Expenditures Price index, why did the Fed switch from CPI to PCE in 2000, and why is it important to investors?
What is PCE?
The Personal Consumption Expenditures Index (PCE) is a comprehensive measure of prices that people living in the United States pay for goods and services. Published monthly by the Bureau of Economic Analysis (BEA), PCE tracks consumer spending across durable goods (cars, appliances), non-durable goods (food, clothing), and services (healthcare, housing, education). Importantly, PCE captures not just what consumers spend out-of-pocket, but also expenditures made on their behalf by employers and government programs.
The PCE Price Index stands out for its ability to capture changes in consumer behavior. When beef prices surge, the index reflects how consumers might switch to chicken or other alternatives, providing a more realistic picture of inflation pressures. This dynamic adjustment is one reason the Federal Reserve considers PCE superior to other inflation measures.
When analyzing PCE, investors encounter two versions. Headline PCE includes all consumer expenditures. Core PCE, which excludes volatile food and energy prices, is the Federal Reserve’s preferred inflation gauge. By removing this “noise,” core PCE allows Fed policymakers and investors to identify persistent inflation trends rather than temporary price shocks.
The Origins of PCE as the Fed’s Primary Gauge
While PCE data has been tracked since January 1959, the index operated in relative obscurity for decades. That changed on February 17, 2000, when the Federal Open Market Committee (FOMC) announced it would switch its primary inflation measure from CPI to PCE. After extensive internal analysis, Fed officials concluded that PCE’s methodological advantages made it the superior tool for assessing inflation and guiding monetary policy.
In 2012, the Federal Reserve formally announced an official 2% inflation target, explicitly defined in terms of year-over-year core PCE. Since then, this 2% target has guided Fed policy decisions and interest rate adjustments, influencing financial market behavior. To dig further into this subject, please see my previous article: “The Origin of the Fed’s 2% Inflation Target and its Relevance to the Markets”
Why the Federal Reserve Prefers PCE Over CPI
The Fed’s preference for PCE stems from three key methodological advantages. First, PCE employs dynamic monthly weighting that captures how consumers actually shift their spending when prices change—CPI only updates annually. Second, PCE provides comprehensive coverage including healthcare spending paid by employers and government programs, representing approximately 22% of PCE versus a minimal weight in CPI. Third, PCE uses a more balanced housing methodology, avoiding CPI’s heavy reliance on homeowners’ equivalent rental estimates that is also slow to reflect more current data.
Since 2000, annual CPI inflation has consistently run about 0.4 percentage points higher than PCE inflation due to these methodological differences. For investors, understanding this divergence is essential when interpreting inflation data and anticipating Fed policy responses.
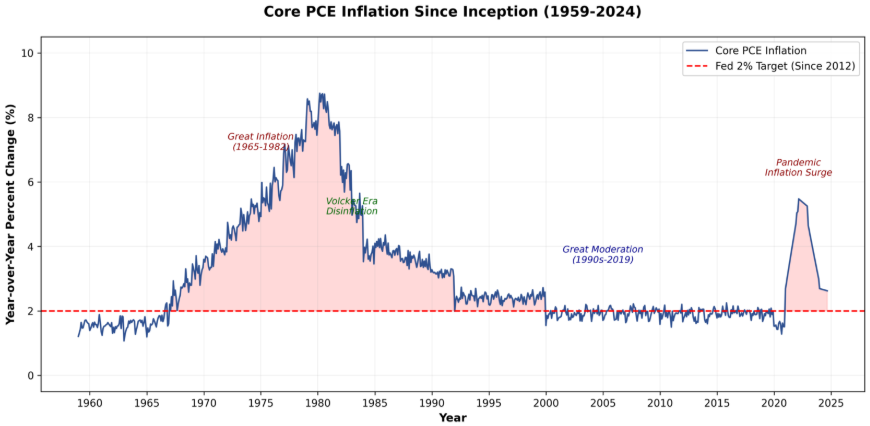
Historical Core PCE Inflation
The chart below illustrates year-over-year core PCE inflation since 1959, highlighting the inflation surge of the 1970s and early 1980s, Volcker era disinflation, the Great Moderation, the pandemic-related inflationary surge, and most recent pullback:
The Impact on Financial Markets
PCE data releases have evolved into high-stakes market events, capable of triggering significant movements across stocks, bonds, currencies and commodities.
Stock Market Reactions
When core PCE comes in hotter (higher) than expected, stock prices typically decline as investors recalibrate their expectations for Federal Reserve policy. Growth stocks and technology companies often suffer disproportionately, as higher discount rates reduce the present value of future cash flows. Smaller cap stocks also tend to underperform, faced with higher borrowing costs. Conversely, lower-than-expected PCE readings often spark equity rallies as investors anticipate a more accommodative Fed stance toward interest rate policies.
Bond Market Impact
Treasury prices respond quickly to inflation surprises. Higher-than-anticipated PCE readings push bond prices down and yields upward, particularly at the front end of the maturity yield curve. The two-year Treasury, most sensitive to near-term policy, often experiences the sharpest moves. Rising yields make existing bonds less valuable while increasing borrowing costs for corporations and consumers. Lower than expected PCE reports generally precipitate the opposite: Treasury prices rise and yields and borrowing costs decline.
Currency and Commodity Markets
Strong PCE inflation typically strengthens the U.S. dollar as higher inflation prompts the Fed to raise or maintain elevated interest rates, making dollar-denominated assets more attractive. Persistent inflation signals can boost precious metals like gold and silver as inflation hedges, while REITs face headwinds from higher borrowing costs and less attractive dividend yields relative to bonds.
What This Means for Your Portfolio
Understanding PCE and its influence on Federal Reserve policy is crucial for effective portfolio management. When core PCE is rising or remains elevated, investors should anticipate continued restrictive monetary policy, pressure on equities, higher bond and money market yields, potential dollar strength, and opportunities in inflation-protected securities.
Conversely, cooling core PCE reports open the door to potential Fed rate cuts, a positive environment for stocks and rate-sensitive sectors such as housing, as well as rising bond prices, possible dollar weakness, and reduced urgency for inflation hedges.
While the Federal Reserve also rigorously evaluates employment data, economic growth and geopolitical events, the PCE index as a key indicator of inflation has emerged as one of the most important monthly economic releases for investors.
Portfolio Managers at Baldwin continuously monitor PCE data and its implications for Federal Reserve policies as part of a comprehensive approach to managing our clients’ investment portfolios.
Sources:
Bureau of Economic Analysis (BEA) – Personal Consumption Expenditures Price Index: https://www.bea.gov/data/personal-consumption-expenditures-price-index
Bureau of Economic Analysis (BEA) – Core PCE (Excluding Food and Energy): https://www.bea.gov/data/personal-consumption-expenditures-price-index-excluding-food-and-energy
Federal Reserve Bank of St. Louis (FRED) – PCE Price Index: https://fred.stlouisfed.org/series/PCEPI
Federal Reserve Bank of St. Louis (FRED) – Core PCE Price Index: https://fred.stlouisfed.org/series/PCEPILFE
Federal Reserve Bank of Cleveland – Center for Inflation Research, CPI vs PCE Infographic: https://www.clevelandfed.org/collections/infographics/2024/infogr-20241205-cpi-versus-pce-price-index
Federal Reserve Bank of Richmond – Economic Focus, Inflation Research: https://www.richmondfed.org/publications/research/econ_focus
YCharts – US Core PCE Price Index Year-over-Year: https://ycharts.com/indicators/us_core_pce_price_index_yoy
The opinions expressed in this Commentary are those of Baldwin Investment Management, LLC. These views are subject to change at any time based on market and other conditions, and no forecasts can be guaranteed. The reported numbers enclosed are derived from sources believed to be reliable. However, we cannot guarantee their accuracy. Past performance does not guarantee future results. We recommend that you compare our statement with the statement that you receive from your custodian. A list of our Proxy voting procedures is available upon request. A current copy of our ADV Part 2A & Privacy Policy is available upon request or at www.baldwinmgt.com/disclosure.
 Susan Berry-Gorelli, CEO, Investment Portfolio Manager
Susan Berry-Gorelli also is the Director of Research and a Portfolio Manager of Baldwin Investment Management. She has over 30 years of individual and institutional investment and risk management experience in the financial services industry. Susan attended The College of William and Mary and the University of Delaware, earning a B.A. in Economics and History, Summa Cum Laude and Phi Beta Kappa. She is the Board Vice President of the Colonial Theatre in Phoenixville, and also serves on the finance committees of the French and Pickering Conservation Trust and the Whitemarsh Boat Club.