Optionality, Flexibility, Adjustability…….
However one might describe the world’s economy, all the above descriptors would seem appropriate. Since the start of 2026, the globe has had to adjust to an extraordinary exogenous political shock with the start of a war in Iran and the collateral damage of a closure of the Strait of Hormuz. Coming into the new year, economists were expecting another year of strong worldwide economic growth with lower interest rates, down by 50 – 75 basis points, as inflation was on track to decline. Robust corporate earnings, sales, and cash flows with increased dividends for shareholders were anticipated by investors. Wall Street was enthusiastic about artificial intelligence (AI) and the corporate spillover effects of a continuing massive capital expenditure boom; not only in technology spend, but in ancillary infrastructure requirements for electricity, cooling, bricks and mortar, etc. Markets started the year strongly with foreign markets, considered cheaper than the US by investors, continuing to outpace American ones.
Then came the war. Worldwide, investors sold international markets and returned to the US in a “flight to safety,” even though America was one of the combatants. Relative outperformance for foreign markets turned quickly to underperformance as stock pickers worried about the relative strengths of various world economies and which ones would be better able to withstand a Middle Eastern energy worry and then supply shortage. Forecasters turned negative on their outlooks fairly rapidly, extrapolating the world’s disastrous economic performance from the oil supply shock of the 1970’s to today, without recognizing major differences in economic situations between the two periods, nor acknowledging how much better the world withstood the wars in Kuwait and Iraq, which were in the 1990’s and 2000’s. Out came worry beads and concerns for an economic calamity. There was little attention paid in news headlines or in expert commentary about optionality or flexibility. Few asked about what was different now, what levers could be pulled this time which were not available in the 1970’s to ameliorate the perceived situation in the Persian Gulf. It was as if commentators believed that no one had learned anything from previous oil supply interruptions, a silly position to take, we have thought.
So why has oil not climbed to $200/barrel(bbl.) with the Strait of Hormuz effectively blocked? First, the US has become in the intervening years since the 1970’s a major exporter of oil, a significant reversal of fortune from being the world’s largest importer in the 1970’s. Second, national oil reserves have been established in many countries, which provides each nation with a “buffer” in case of a Strait of Hormuz-type cutoff. Since the start of the war with Iran, these national reserves have been tapped to supply markets and keep price increases restrained. Further, within the Middle East, lessons were learned during the Iran/Iraq war, resulting in pipelines being built in Saudi Arabia and the United Arab Emirates (UAE) to circumvent the Strait of Hormuz.
CHART 1
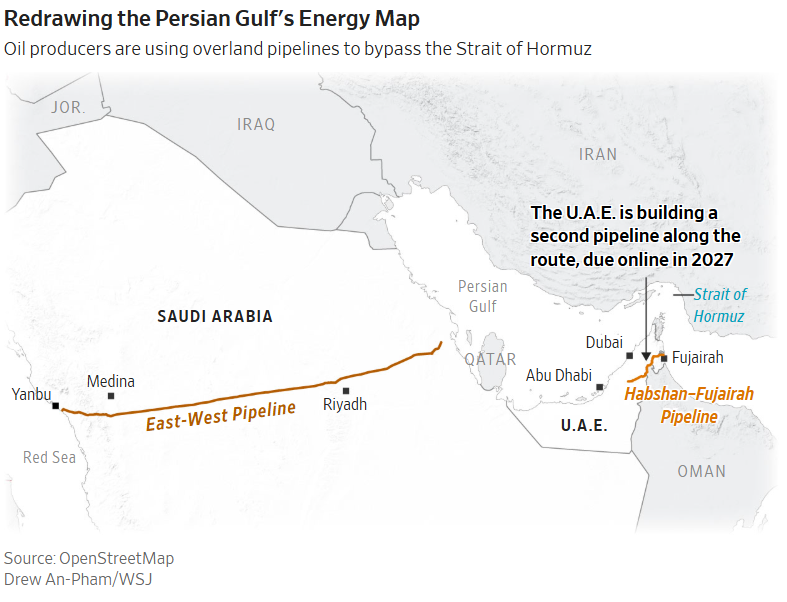
In the EAST WEST pipeline, Saudi Arabia transports about 7 million bbl./day to Yanbu on the Red Sea, far away from the Strait. The UAE is moving approximately 2 million bbl./day to the Gulf of Oman, south of the Strait, avoiding the fighting. These pipes were self-help projects several years ago as a result of lessons learned – but for weeks into the conflict many commentators were declaring that still 20% of the world’s oil supplies moved through the Strait when actually much less was kept from moving through the Strait because of the pipelines. More pipelines are expected to be built to diversify the shipping risk away from the Strait. Maritime transport of oil is cheaper than building new pipe – but the expense of new pipe is worth the price of transport diversification as well exampled with this war. Additionally, there are many more sources of supply than before. For instance, the Western Hemisphere now produces more oil than the Middle East. Canada, Brazil, Venezuela, Argentina and Guyana are new productive areas or are producing much more than they used to, which provides an important, diversified resource base for oil which should help prevent energy supply shocks.
Liquified natural gas (LNG) was not a fuel widely used in the 1970’s. The technology of freezing dry natural gas into a liquid to be transshipped around the world was not practiced widely. Today, with higher natural gas prices and better developed cryogenic technology, LNG is supplanting oil in many energy uses, for example or heating buildings or generating electricity. Again, this is an important example of diversification of energy supplies, making Middle Eastern oil less significant in the world’s energy matrix than it used to be.
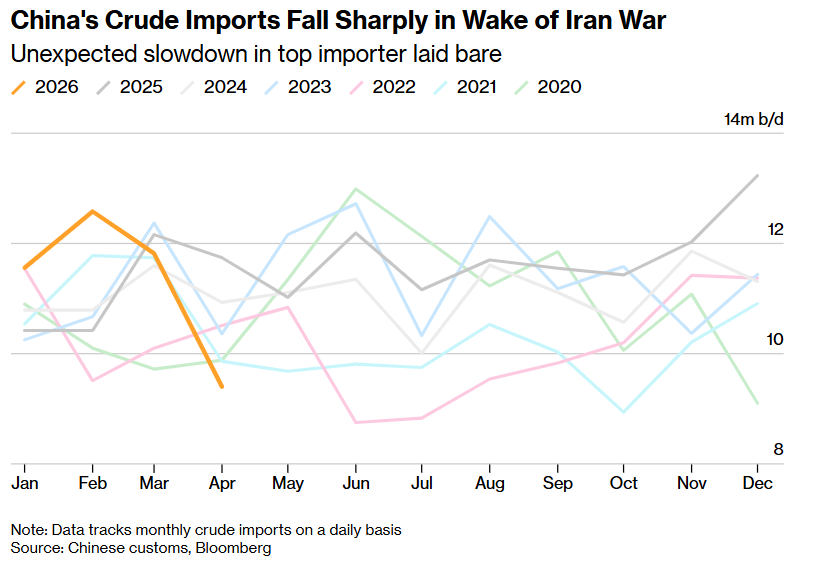
On the demand side of the current supply/demand equation, China reduced its demand for oil by some 40% during this oil supply interruption, according to Martijn Rats from Morgan Stanley. This was a surprise to the markets, which had assumed that demand would hold steady. China today is the largest importer of oil in the world and has also spent years and billions of dollars creating and expanding its national reserve. Not willing to pay too high a price for oil, China tapped its reserves, helping others.
CHART 2
Further regarding energy diversification, France now relies primarily on nuclear for electric generation. Japan is leading the development of LNG to push oil out of its electric generation. Wind, solar, geothermal and hydro have also much more widely spread around the world to move the world away from an oil- only energy system. These are reasons why oil did not spike to $200/bbl. even though the Strait was effectively closed. The world has learned from past Middle Eastern experiences that diversity of supply is an important defense or hedge against an energy calamity. We are not for a second trying to minimize the seriousness of the Strait’s effective closure. But we are also not trying to “hype” its closure. We do think that oil prices will fall once the war is over but will not readily fall to $60/bbl. as it was before the war. First because there will need to be repair to numerous energy systems damaged by the war, Further, we think that “safe” barrels, like those generated in the Western Hemisphere, may be awarded a premium price for their safety.
While oil prices have not leapt to $200/bbl., they are still up quite significantly so far in 2026. Because energy costs figure importantly in the cost of many products and services, the increased cost of oil, according to some forecasters, has bled into the American Consumer Price Index (CPI) and Producer Price Index (PPI). This has led several at the Federal Reserve, who were once leaning toward lowering interest rates later in 2026, to hesitate regarding the immediate future course of rates. The general public, voiced through recent surveys, has increased their outlook for inflation – not dramatically, but increased nonetheless. As inflation has yet to achieve the Fed’s 2% target and recent employment numbers have been stronger than expected, there are a growing number of Fed officials who are talking about an increase in interest rates, not a decline. This is certainly not something that investors were expecting at the start of the year. Rising interest rates are usually not good for stock prices. We too were looking for lower interest rates at the start of 2026 to support equity market valuations. That prop seems to have disappeared. Additionally, there is a new Chairman of the Fed, Kevin Warsh. It is supposed that he will be under considerable political pressure to lower interest rates. As Chairman, Mr. Warsh will certainly control Fed meetings and agendas. But he has only one vote. To change the current leanings of several other Fed voting members who have publicly expressed a position of standing pat on interest rates or even be amenable to an increase in rates, Mr. Warsh, we think, is going to have to change hearts and minds. Unless some important inflation and employment numbers change direction in the next few months, that may be a tall order.
In our view,the sturdiest support for current market valuations is corporate performance. Earnings, cash flow, sales and dividend growth have continued to surprise Wall Street analysts. Company margins (i.e., the delta between what a company sells an item or service for and what it costs to produce that item or service) have recently approximated 11.5% – relative to an average of around 7%.
CHART 3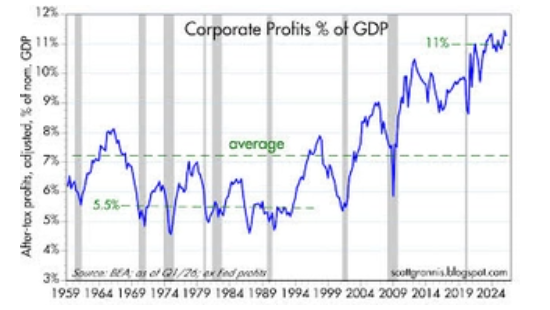
Analysts have for years projected margins to return to long term medians. But margins have expanded, and corporate America is far more profitable than it has been historically. Company sales have increased, regulations and restrictions on business have decreased, productivity has improved with the utilization of technological advances (think internet and now AI), and capital expenditures have mushroomed to build and support the AI infrastructure. Some investors worry that the US market has come too far, too fast. Yet, as measured on a price/earnings (P/E) basis, the most recognized form of valuation measurement among investors, the S&P 500 is cheaper today than it was at the start of the year. Corporate earnings and cash flows are growing quickly – more quickly than stock prices. We believe there remains value in the markets.
A COUPLE OF MORE CHARTS……
CHART 4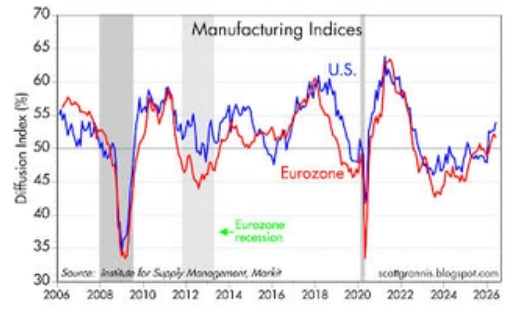 Improving Manufacturing Conditions In The US And The Eurozone
CHART 5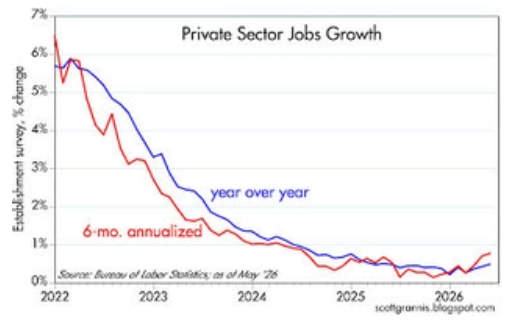 Job Growth Is Improving While Unemployment Is Low
CHART 6
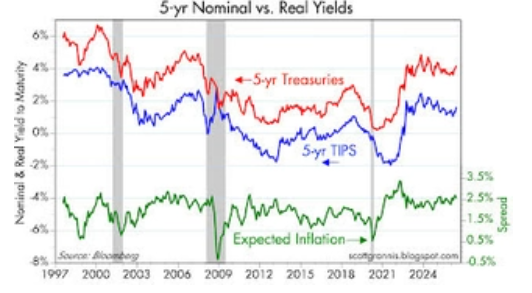
While Consumers & The FED May Be Somewhat Concerned About Inflation, The Bond Market Is Not!
A Final Thought….

The opinions expressed in this Commentary are those of Baldwin Investment Management, LLC. These views are subject to change at any time based on market and other conditions, and no forecasts can be guaranteed. The reported numbers enclosed are derived from sources believed to be reliable. However, we cannot guarantee their accuracy. Past performance does not guarantee future results. This commentary is for information purposes only. Nothing herein should be construed as investment advice or a recommendation to buy or sell any security. Forward-looking statements are based on current assumptions and are subject to change. A current copy of our ADV Part 2A & Privacy Policy is available upon request or at www.baldwinmgt.com/disclosures.
 Peter H. Havens, Chairman
Peter Havens founded Baldwin Investment Management, LLC in 1999 after serving as a member of the Board of Directors and Executive Vice President of The Bryn Mawr Trust Company. Previously he organized and operated the family office of Kewanee Enterprises. Peter received his B. A. from Harvard College and his M. B. A. from Columbia Business School. He serves as Chairman of the Lankenau Institute for Medical Research. He is a Board member of AAA Club Alliance, Main Line Health, The Lankenau Medical Center Foundation, and the former Vice Chairman of Main Line Health. He is a Trustee Emeritus at Ursinus College, Chairman Emeritus of the Board for the Independence Seaport Museum, former Trustee of the Leukemia Society of America, and a former board member of Main Line Health Realty and Lankenau Development Inc. He was also the Chairman of the Board of Petroferm, Inc. and a Board member of Nobel Learning Communities Inc.