Many long-term investors are familiar with the adage “time in the market beats timing the market.” This simple concept, coined by former fund manager and author, Ken Fisher, provides a message to investors that allowing investments to compound over time, through good times and bad, will consistently win out over habitually exiting and re-entering the stock market. The data behind this is strong, showing that the average investor consistently underperforms the stock market indices, primarily due to poor timing and emotional decision making. The allure of market timing is powerful. Who wouldn’t want to buy at the bottom and sell at the top, capturing every market swing for maximum profit? What the data shows is much more sobering. When markets soar, investors pile in at peaks. When crashes occur, many sell at the bottom, liquidating quality investments at fire sale prices in exchange for the perceived safety of holding cash. To be fair, it should be considered that not every investor is the “average investor” and perhaps those with greater discipline and experience may possess the ability to navigate stock market swings. This article will provide some analysis on several well-known seasonal patterns and whether it is realistic for a long-term investor to rely on these patterns as part of a long-term investment strategy.
#1 – September’s Notorious Reputation
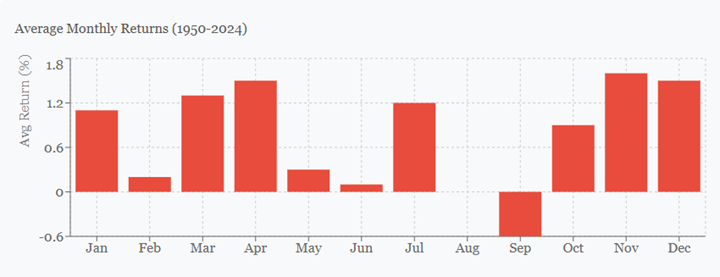
Having just flipped the calendar from September, let us start here. Sometimes called the “September Slump”, it stands alone as historically the worst month for stock performance. Since 1950, September has produced average returns of negative 0.6%, making it the only month with a negative average return. Major market crashes, including those in 1929, 1987, and 2008, have occurred or accelerated during September, cementing its reputation.
As convincing as this data is, what it does not depict is that September has produced stock market gains 45% of the time. In fact, the S&P 500 rose 3.8% in September of 2025, its best result in the past 15 years. So, an investor with a timing strategy of sitting on the sidelines in September would now be faced with the unpalatable prospect of re-entering stocks at meaningfully higher prices. When could it make sense for an investor to avoid the month of September? An investor with an imminent cash need, or an upcoming required withdrawal from a retirement account, may choose to accelerate this process by converting some funds to cash before this statistically weak month.
#2 – “Sell in May and go away”
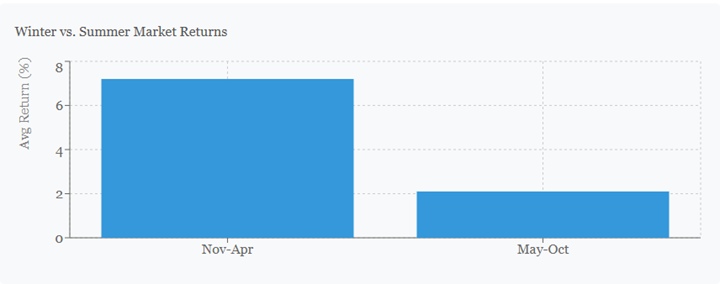
Perhaps the most famous seasonal pattern is encapsulated in the old Wall Street adage: “Sell in May and go away.” This strategy suggests investors should exit the market in May and return in November, avoiding the summer months. The historical results provide surprising support. From 1950 to 2024, the S&P 500 has delivered an average return (including dividends) of approximately 7.2% during the November-to-April period, compared to just 2.1% from May through October.
Several theories attempt to explain this phenomenon. Lower trading volumes during summer vacation months may contribute to reduced liquidity and increased volatility. Additionally, institutional investors often lock in gains before the summer, creating selling pressure. Whatever the cause, the pattern has been remarkably consistent, appearing not just in U.S. markets but in over 90% of developed markets studied by researchers.
#3 – “The Santa Claus Rally”
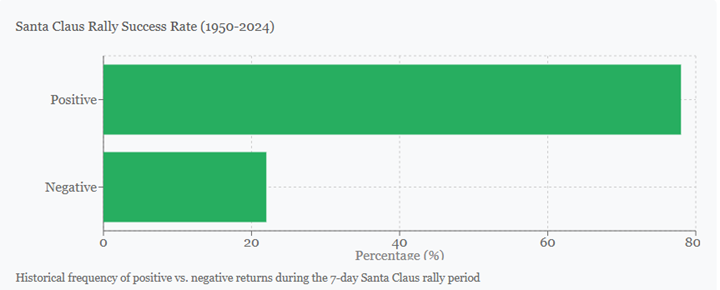
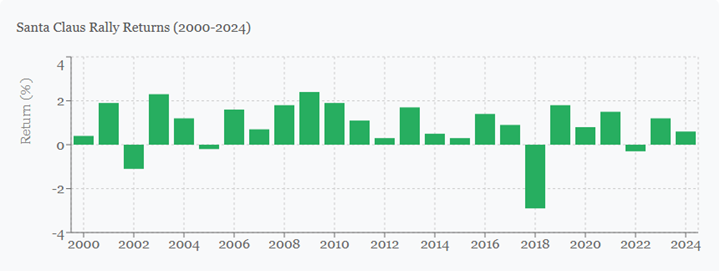
If the summer doldrums spell caution for investors, the year-end holidays bring optimism. The “Santa Claus Rally” refers to the tendency for stocks to rise during the final five trading days of December and the first two trading days of January. Since 1950, this seven-day period has produced positive returns approximately 78% of the time, with an average gain of 1.3%. While the effect is modest in absolute terms, its consistency has made it a perennial topic for market commentators around the holiday season.
Explanations for this pattern range from practical to psychological. Year-end bonuses may increase investment capital, tax-loss harvesting (selling of underperforming stocks for a tax benefit) creates buying opportunities, and general holiday optimism might create increased risk appetite among the masses. Institutional factors may also play a role, as fund managers may engage in “window dressing” – the practice of buying more shares of top performers to push prices higher at year-end.
#4 – The January Effect
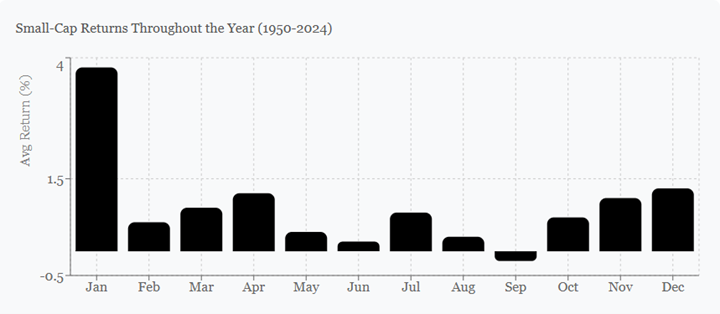
Last but not least is “The January Effect” which refers to the tendency of small-cap stocks to outperform large-cap stocks during the month of January. Historically, small-cap stocks have delivered January returns averaging 3.8%, compared to 1.2% for large-caps, a difference far exceeding normal monthly variations. Tax-loss harvesting provides the most logical explanation. Tax conscious investors sell losing holdings in December to offset capital gains, with small-cap stock prices sinking more due to their lower ability to absorb the selling pressure. Come January, these depressed stock prices bounce back as the market rediscovers the true equilibrium between buyers and sellers. The chart below shows the average monthly returns of small-cap stocks dating back to 1950.
Our Conclusions
While these seasonal patterns are fascinating to observe, what does it mean for you as a long-term investor? One may ask why they have not been arbitraged away by nimble traders or automated trading models. The answer lies in transaction costs such as having to pay short-term capital gains tax and fees that could largely eliminate any edge to be had from trading around seasonal trends. Perhaps more importantly, these patterns aren’t reliable enough for consistent short-term trading. The Santa Claus Rally produces positive returns 78% of the time, but that means it fails 22% of the time. September is the worst month on average, but it still delivers a positive return 45% of the time. For long-term investors, attempting to time the market around these patterns often costs more in missed opportunities than it gains in avoided losses, not to mention the added stress felt during the inevitable periods of poor performance.
With this said, the mantra of advice around never trying to time the market in any capacity can be overly dogmatic. As advisers and investors, we are aware of seasonal trends and may use those patterns to our clients’ advantage in specific situations such as when to invest a large cash balance or prepare for a withdrawal to meet a cash need. For most investors, awareness of seasonal patterns provides an interesting context for market movements, but patient, diversified, long-term investing remains the most reliable path to wealth creation, regardless of what the calendar says.
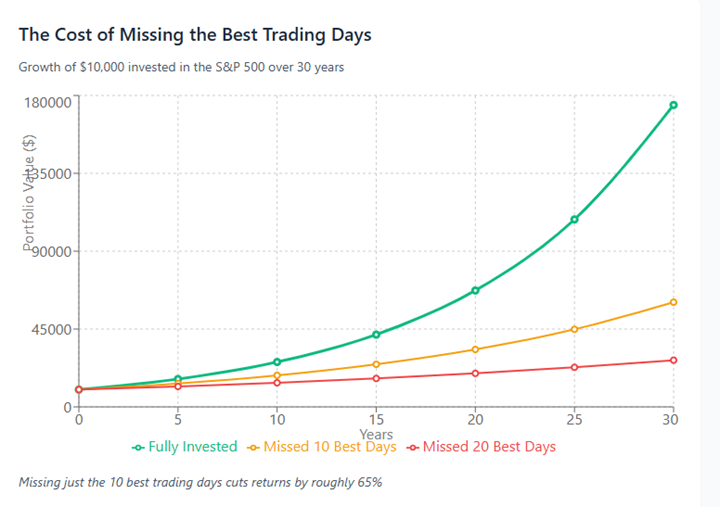
So, the next time you feel the urge to make a change to your long-term investment strategy, please consider the chart below in addition to consulting with your Baldwin or RKM portfolio manager. If you missed just the ten best trading days in the S&P 500 over the past thirty years, your returns would be cut roughly in half. The cruel irony? Those best days often occur during volatile periods, clustered near the worst days—precisely when nervous investors flee to the sidelines.
*The charts in this article were sourced with the assistance of Anthropic AI, referencing the following:
Source: S&P 500 Index historical data, 1950-2024
Source: Russell 2000 and S&P 500 Index historical data, 1950-2024
The opinions expressed in this Commentary are those of Baldwin Investment Management, LLC. These views are subject to change at any time based on market and other conditions, and no forecasts can be guaranteed. The reported numbers enclosed are derived from sources believed to be reliable. However, we cannot guarantee their accuracy. Past performance does not guarantee future results. We recommend that you compare our statement with the statement that you receive from your custodian. A list of our Proxy voting procedures is available upon request. A current copy of our ADV Part 2A & Privacy Policy is available upon request or at www.baldwinmgt.com/disclosure.
 Jared V. Quereau, Managing Director
Jared Quereau is a Portfolio Manager and Investment Committee member for Baldwin Investment Management. He has 26 years of industry experience and joined Baldwin in 2020. Most recently, Jared held the roles of Portfolio Manager and Technology sector analyst at BB&T Securities, the successor firm of the Stratton Management Company. His prior experience includes Equity Trader at Great Point Capital and Registered Representative at Charles Schwab & Company. Jared earned a B.S. in Finance from the University of Colorado at Boulder and is a member of the CFA Institute and CFA Society of Philadelphia.